地磁気センサBM1422GMVによる地磁気計記録の紹介.Y.Okamoto 改訂版 2025-08-24
2024-05-18
そ
の後観測には進展があり,磁気嵐めいたものを観測できている.観測場所は自宅ではなく,筆者が大阪府教育センター時代にお世話になった室井勲氏のご自宅
(大阪府河内長野市の山間部に近い新興住宅地).この場所は南海高野線の線路から直線距離2.6kmと離れていて,直流電車の磁界の影響を受けにくい.こ
の場所で観測したデータと大阪教育大学で同様に観測したデータの比較の議論が下記の学会発表でなされている.これをぜひごらんいただきたい.
(近日公開)
またこの観測所を探す前に,筆者の高校の教え子が勤務する近隣の大学キャンパスでの観測記録をまとめたものが下記の学会発表となる,合わせてごらんいただきたい.
http://seagull.stars.ne.jp/2024_Oita/2024-Oita_Poster_Eng.pdf
なお,直流電車による磁界の影響については下記のURL,及び文献で議論されている.
https://official.rikanenpyo.jp/posts/6662
https://www.kakioka-jma.go.jp/publ/journal_DB/pdf_files/memoirs_of_KMO_50_03.pdf
格安地磁気センサBM1422GMVによる地磁気計記録の紹介.Y.Okamoto 2024-05-18, 2024-07-17
Preliminary report of magnetometer recordings with the BM1422GMV low-cost geomagnetic sensor
お断り:
この観測データの縦軸はμT(下のグラフは一部nTで表示)で日変化を観ると,500nTを超えるものがある.地磁気観測所などでの日変化は50〜100nT程度なのでそれより有意に大きい.(https://vldb.gsi.go.jp/sokuchi/geomag/menu_03/observatory_data.html)
したがってこれが,地磁気の自然変動を表しているとは考えにくい.何らかの人為源,もしくは機材や観測環境のノイズを含んでいる含んでいる可能性が高い.しかし同様の観測データをあまり見ないのでここに公開する.他の地域や観測環境のものと比較したいと考えている.
なお現在までに「磁気嵐」に相当するものの観測はできていない(2024-07-17)
→これですが,その後08/12-08/14のやや大きな磁気嵐(250nT超え)のときに変動らしきものを記録した.この件,週末からの大分の学会で発表予定なので,学会終了後にアナウンスします.今しばらくお待ちください(2024/08/16),
Notes:
The
vertical axis of this observation data is [μT] (some of the graphs
below are shown in [nT]), and some of the daily variations exceed 500
[nT]. The
daily variation is significantly larger than that at geomagnetic
observatories, where the daily variation is around 50 to 100 nT. (https://vldb.gsi.go.jp/sokuchi/geomag/menu_03/observatory_data.html)
Therefore, it is difficult to believe that these variations represent natural changes in the geomagnetic field. It is more likely to include some kind of artificial source, or noise from equipment or the observation environment. However, we have not seen similar observation data, so we are publishing it here. We would like to compare the data with those of other regions and observation environments.
No observation corresponding to a “magnetic storm” has been made by now (2024-07-17).
New daily data are uploaded at the folloewing pages on 2024-05-24;
http://seagull.stars.ne.jp/Magnetometer/BM1422GMV/daily_record1.html
前回の地磁気計はチープではあるものの,センサ特性に不安があるのと,本来の純正品ではないのでセンサを別のものに換えた.今回用いたのはROHM社生産で日本ではスイッチサイエンスで入手できるBM1422GMV
という地磁気センサを用いた.価格は送料を除いて2000円ほどである.このセンサはデータシートも完備され,出力単位も[uT](マイクロテスラ)であ
ると仕様書に明記されている.Arduino基板との接続もi2cで前回のセンサと同様に簡単にできる.さらにROHM社のWebサイトからダウンロード
したテスト用のプログラムをArduinoIDEにロードすることで,容易にデータをPCをに取り込むことが可能となる.
Although
the previous magneto-sensor is cheap, I replaced it with another one
because I was not sure about the sensor characteristics and because it
is not a Honeywell geomagnetic sensor. This time, I used a magneto-sensor named BM1422GMV, which is manufactured by ROHM and available from Switch Science in Japan. The price was about 2000 yen, excluding shipping costs. The
sensor has a complete datasheet, and the output unit is specified as
[uT] (MicroTesla). i2c connection to the Arduino board is easy, just
like the previous sensor. In
addition, by downloading the test program from the ROHM website and
loading it into ArduinoIDE, data can be easily imported into a PC via
Serial com. software.
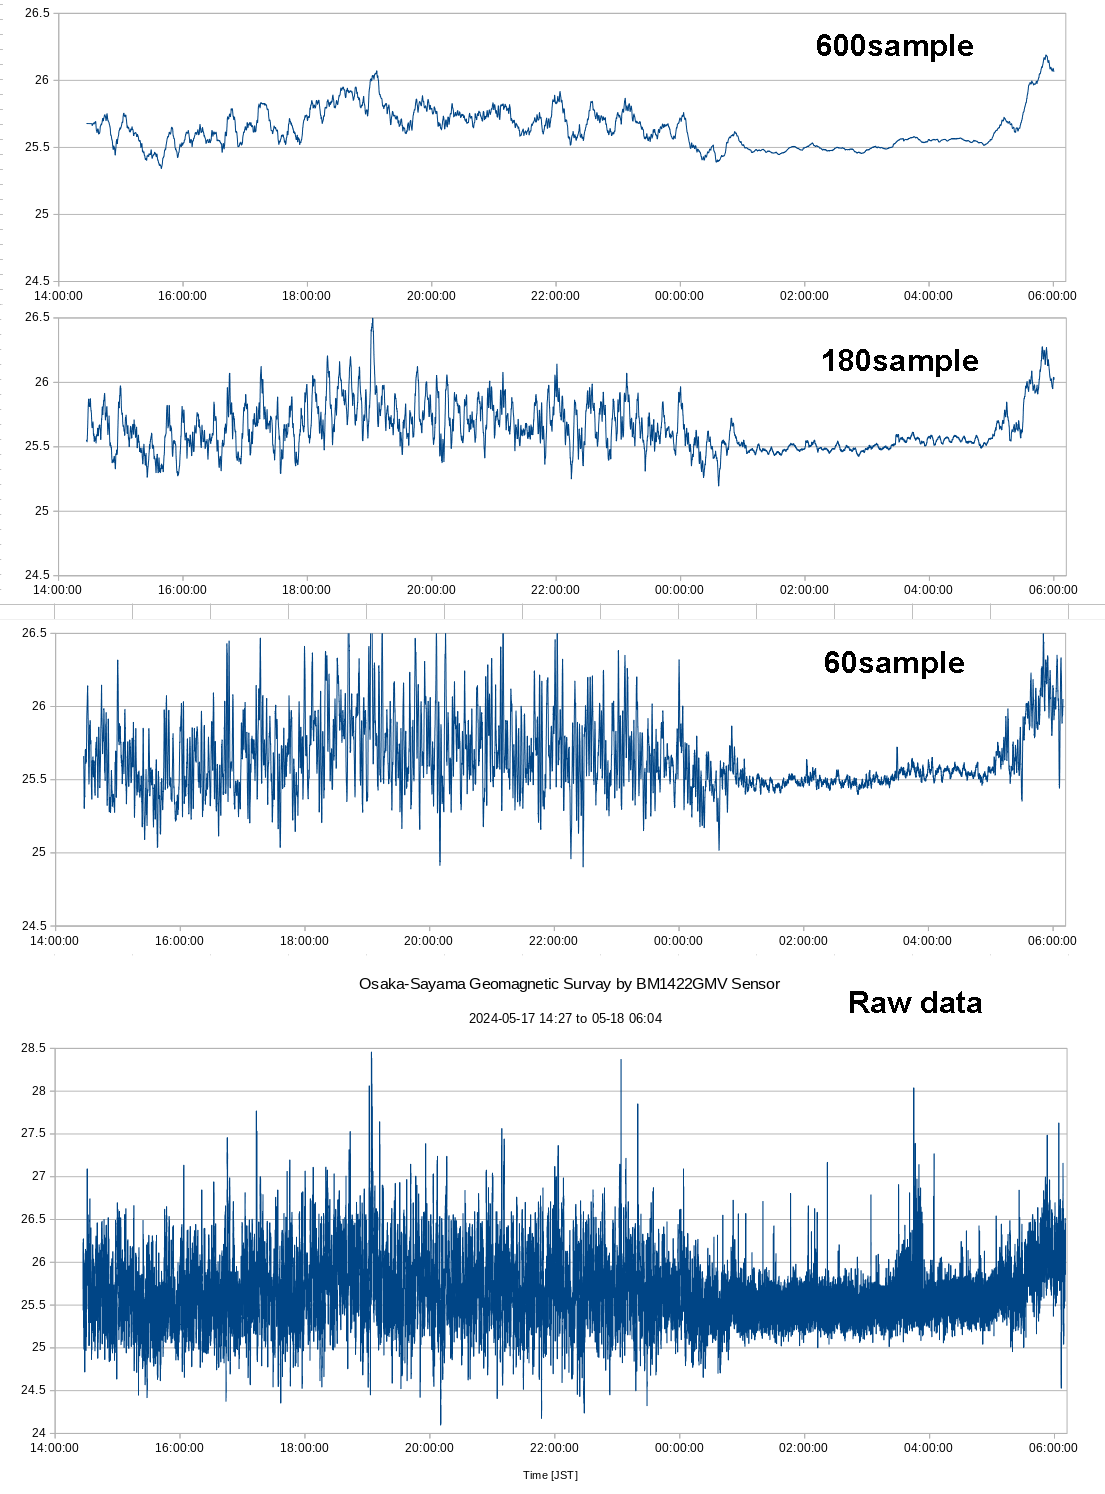
こ
ちらが昨日午後から今朝までの15時間あまりの記録.一番下が生のデータ.上が順に移動平均のサンプル数を増やしたもの.順に1分,3分,10分の窓を掛
けた移動平均(ローパス)計算処理になる.これをみると一番上のものでは,1日の変動幅は例外を除いて50uTに収まっている.これは柿岡の地磁気データ
とほぼ同じレベル.ただし波形は異なる.やはり人工的な磁場の影響が強い.それでも特筆すべきは,前回のセンサと同様,夜は午前0時すぎにノイズが収ま
り,朝5時すぎから再びノイズが出てきているところ.昼間の振動の様子は移動平均のレベルにより若干異なってみえる.これで次の磁気嵐を待ちたいところ.
This is a 15-hour record from yesterday afternoon to this morning. The bottom is the raw data. The top is the moving average with the number of samples increased in ascendig order. There are a moving average (low-pass) calculation with 1-minute, 3-minute, and 10-minute windows, in ascending order. The top one shows that the daily fluctuation range is within 50 uT with some exceptions. This is almost the same level as the Kakioka geomagnetic data. However, the waveform is different. The influence of the artificial magnetic field is still strong. Still,
it should be noted that, as with the previous sensor, the noise
subsides after midnight at night and reappears after 5:00 a.m. The oscillations during the daytime appear to be slightly different depending on the moving average level. We are waiting for the next big magnetic storm.
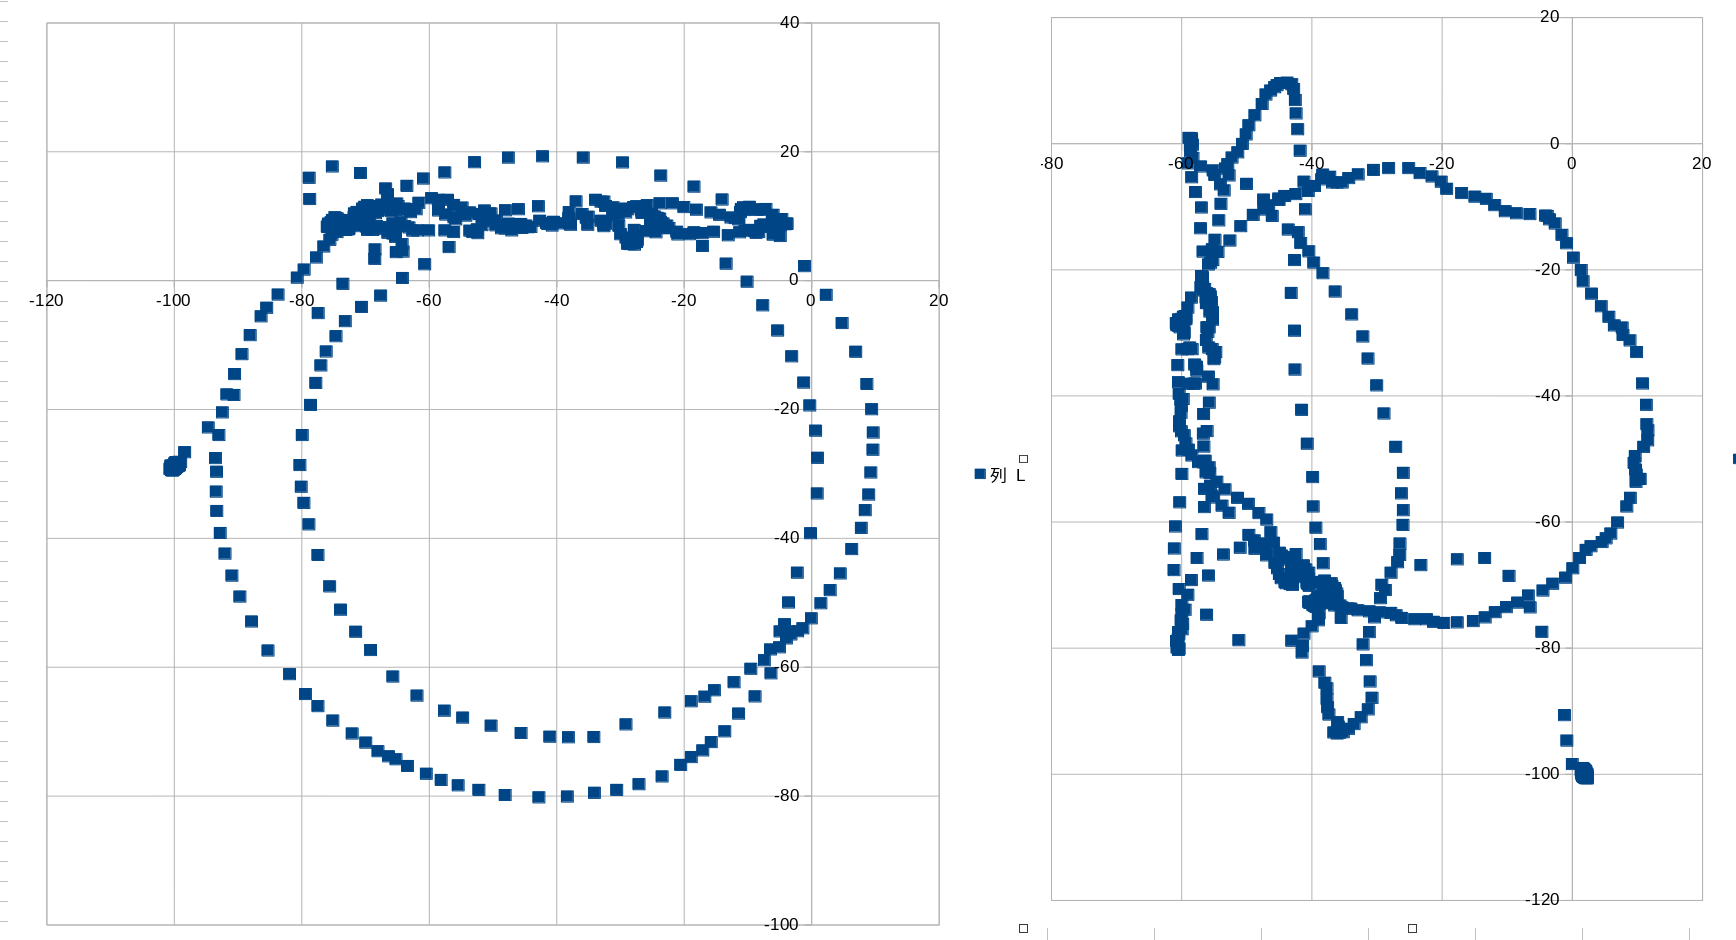 こ
れが観測に入る前に,基板を持って水平と,垂直方向に回転させたときの記録.左がxy平面,右がxz平面とyz平面の軌跡を示す.ただし記録は全回転の記
録になる.これを観ると次に示す前のセンサに比べてとてもきれいな円弧を描いていることがわかる.これだけでもこのセンサの観測値の信頼性が高いことがわ
かる.
こ
れが観測に入る前に,基板を持って水平と,垂直方向に回転させたときの記録.左がxy平面,右がxz平面とyz平面の軌跡を示す.ただし記録は全回転の記
録になる.これを観ると次に示す前のセンサに比べてとてもきれいな円弧を描いていることがわかる.これだけでもこのセンサの観測値の信頼性が高いことがわ
かる.
This is a record of the horizontal and vertical rotations of the substrate before starting the observation. The left image shows the trajectory in the xy-plane, and the right image shows the trajectory in the xz-plane and yz-plane. Note that the recordings are for the entire rotation. This shows that the sensor has drawn a very beautiful arc compared to the previous sensor shown below. This alone shows the high reliability of the observed values.
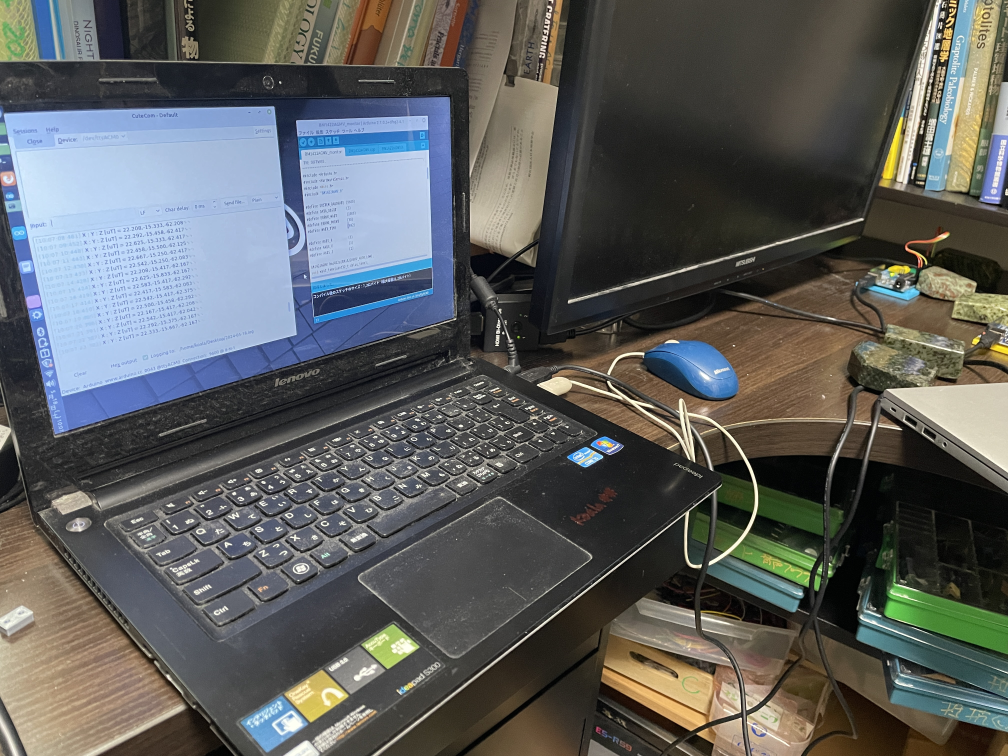
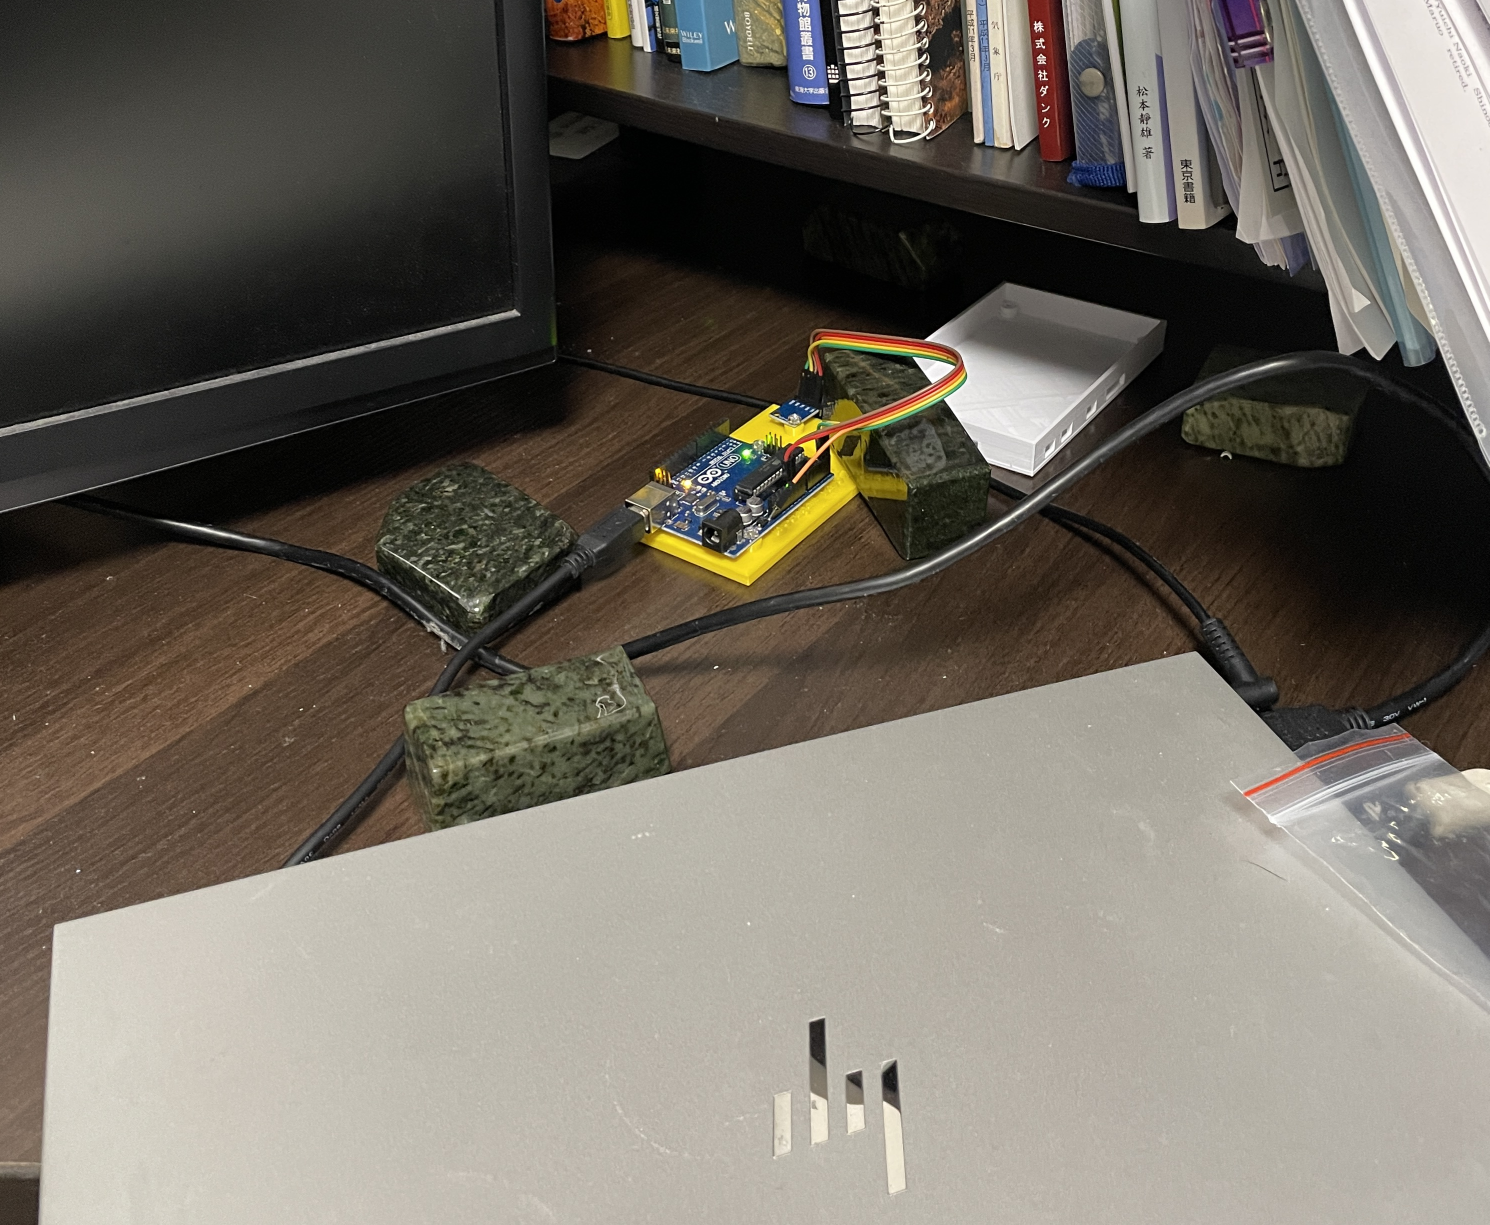
右手奥の青い基板にArduino+BM1422GMV.別のPCにソフトをインストールした.
Arduino+BM1422GMV on the blue board at the back right.
格安地磁気センサQMC5883Lによる地磁気計記録の紹介.Y.Okamoto 2024-05-16
Preliminary report of magnetometer recordings with the QMC5883L low-cost geomagnetic sensor.
「いかにチープな機材で,どれだけ高級な観測に肉薄できるか」という私のポリシーに沿って,Amazonで330円/個の地磁気センサを用いた磁力計を製作した.ここにそれを紹介する.
According to my policy of “how cheaply can I make a precise observation on Geophysical field? I show it here.
※以下のデータは一切のセンサのキャリブレーションを行っていない生(Raw)データを用いている.x.yの水平成分のみの合成.ただ下記に記すように移動平均だけは絶対に必要.
観測環境:南海高野線の駅裏の住宅地内にある木造の自宅2Fの自室机上にセンサを固定.電車や線路の信号電流の影響が強く出ていると想像される.高圧線は近くには通っていない.
机上の観測機の周囲はノートPC,液晶モニタ(以上2つは起動を止めている),通常の書斎の本棚などがある.特に磁気遮蔽など行っていない.また時刻表記には最大40分程度の誤差がある.
The following data are raw data without any sensor calibration. However, only the moving average is absolutely necessary as described below.
Observation
environment: The sensor is fixed on a desk in my room on the second
floor of my wooden house in a residential area behind the Nankai Koya
Line station. It is assumed that the signal currents of trains and railroads have a strong influence on the sensor. There are no high-voltage lines nearby.
The
observation equipment on the desk is surrounded by a notebook PC, LCD
monitors (are not running), and a bookshelf in my room. There is no magnetic shielding.There is an error of up to 40 minutes in the time stamps.
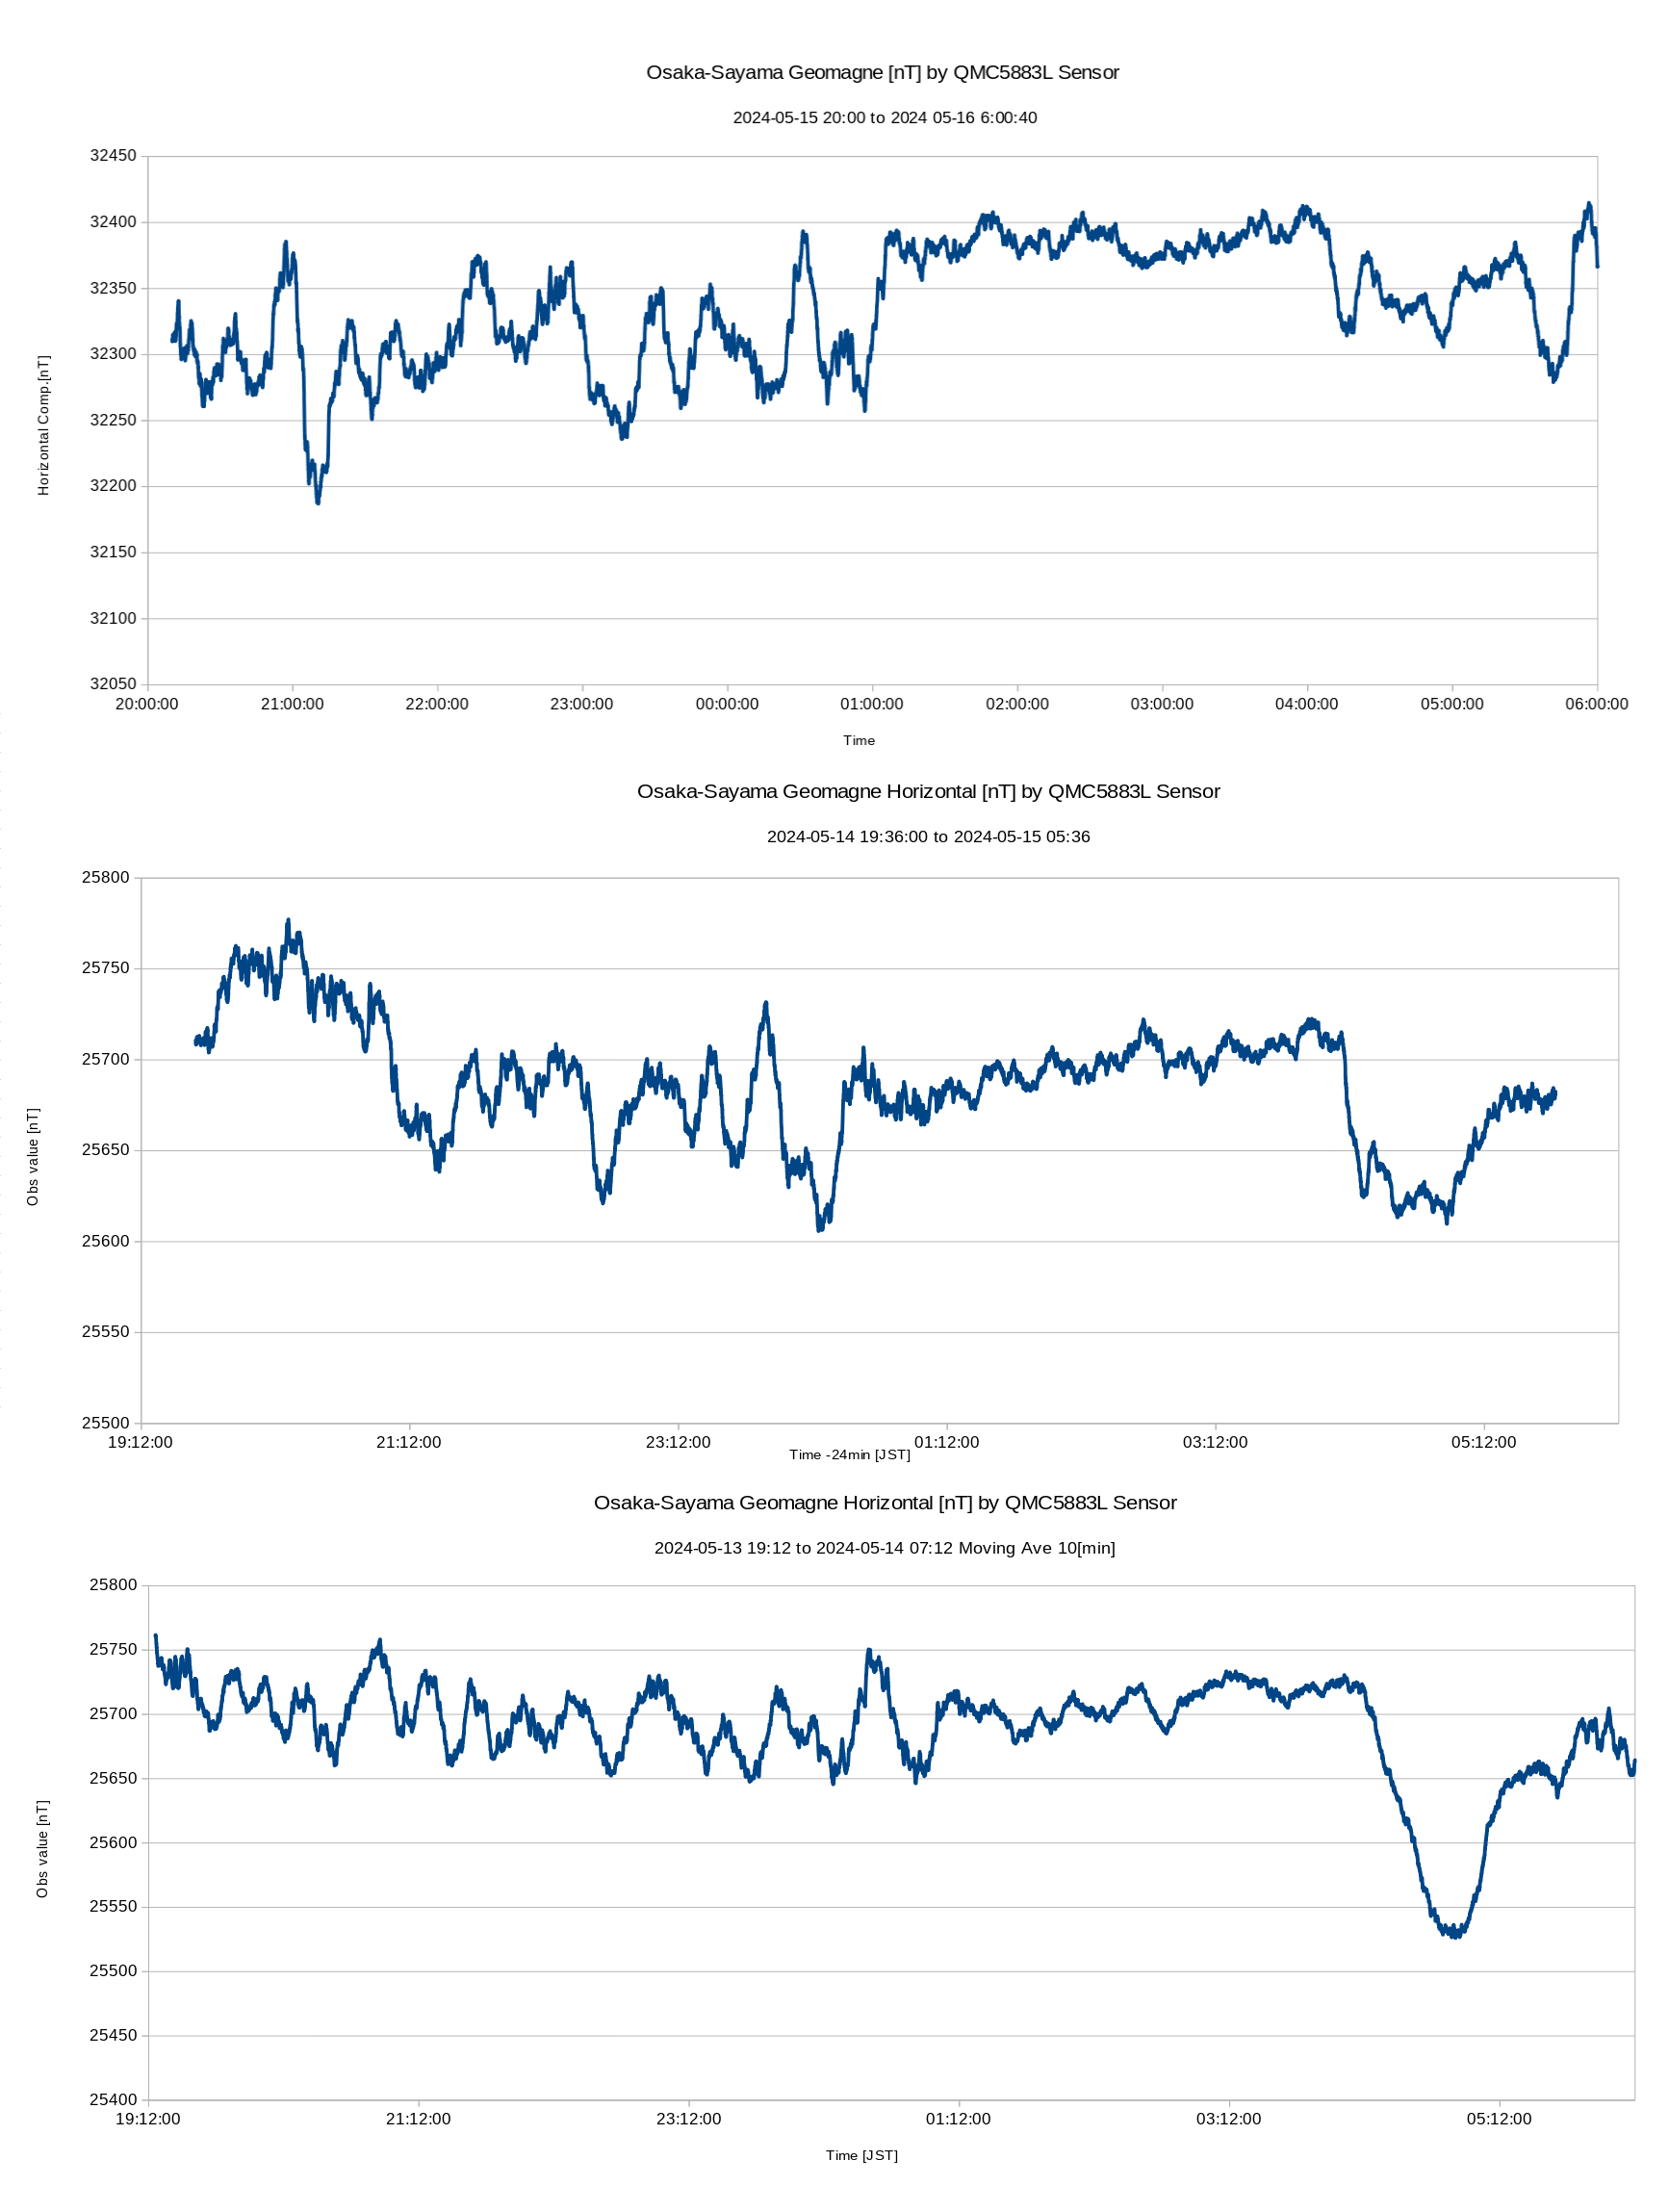
下のグラフ:観測最初の日で13日夜から14日早朝にかけての記録.朝5時前の落ち込みが,これは磁気嵐の変動かと思ったが,次の日とその次の日(上の図)も同じ変動が見えるので,人工の信号である可能性が高いと判断した.
次にこの3日間のデータ比較から言えることを記す.
1)変動の絶対値は,150[nT]くらいに相当する.午前0時ころまでは,3日ともに振動するトレンドが見える.しかし深夜にいたるとそれが消える.
2)早朝に落ち込みが顕著(とくに14日と15日)
3)3日とも共通に似たような変動が観測されている.
4)午前0時あたりまでの振幅の周期は約20分,変動幅は通常100[nT]程度.最大150[nT]
The graph below: The first day of observation, from the night of the 13th to the early morning of the 14th May. At
first, I thought that the drop before 5:00 a.m. might be caused by a
magnetic storm, but the same fluctuation was seen on the next day and
the 3rd day (above), so I judged that it was most likely artificial
signals.
The following is a comparison summery of the data from these three days
1) The absolute value of the fluctuation corresponds to about 150[nT]. However, it disappears at midnight.
2) Early morning depressions are remarkable (especially on 14th and 15th).
3) Similar fluctuations during night are observed on three days.
4)
The period of the amplitude is about 20 minutes until about midnight,
and the width of the variation is usually around 100[nT] instead the maximum 150[nT].
3日にわたる夜間観測から,これらの記録には上記に共通する特性がある
さらに定性的にはこのセンサはある程度,真実を記録している可能性が高い.
以上のことがわかった.
まだ今回の太陽のフレアなど活動は,収まっていないので,次の大規模フレアに伴う磁気嵐(200〜600[nT])が記録できるかに挑戦したい.
Based on three days of nighttime observations, these records share some of the characteristics described above.
Furthermore, qualitatively, the sensor is likely to record real phenomena to some extent.
These are the findings above.
Since
the solar flares and other activities have not yet subsided, we would
like to try to record the magnetic storms (200 to 600[nT]) associated
with the next large-scale sun flare.
<観測したデータについて>
観測データは,ArduinoIDEのシリアルモニタで見れるが,保存はできない.そこでPCにシリアル通信でデータを取得する.WindowsではTeraTerm,筆者のLinuxではCutecomを用いる.データ取得方法はそれぞれのソフトの説明を参照のこと.
また取得データの数字が何を意味するかは,この石の資料がないので,判断できないが総合的に考えて,おそらく地磁気のx,y,z成分の強さを「nT]で示したものだと考えている.本論ではそれを前提に議論する.
これでデータがファイルで取得できるが,そのままではノイズまみれでとても汚い.そこで得られたデータにローパスフィルタ(移動平均)処理を行う.この処
理は筆者はawkによるコマンド処理で行っている.下記スクリプトはChatGPTで取得.window_sizeで移動平均するサンプル数を選択.ここ
では10分のデータを用いている.
この処理は表計算ソフトでも時間はかかるができると思う(指南サイトが多数ある).
<About the observed data>
The data can be
viewed on the serial monitor of ArduinoIDE, but cannot be saved. So we
use Cutecom (an alternative of Telaterm on Windows) to input data via
USB port. Please refer to the description of each software for the data acquisition method.
Although it is
impossible to determine what the numbers in the acquired data mean
because of the lack of datasheet on the sensor, we believe that they
probably represent the strength of the x, y, and z components of the
geomagnetic field, unit as [nT]. This is the premise of the discussion in this study.
The data can be obtained as a file, but as it is very noisy and dirty. Therefore, a low-pass filter (moving average) is applied to the raw data. The author performs this processing by command processing using awk. The script below is obtained from ChatGPT, where window_size is used to select the number of samples as moving window. Here, 10 minutes (600 [sec]) of data is used.
This process can be done with spreadsheet software, although it may take a long time (there are many instructional web sites).
ChatGPT suggests to use the follong script,
#!/usr/bin/awk -f
# ./moving_avg.awk data_file > result.dat
BEGIN {
# Define the window size (you can adjust this value)
window_size = 600
}
{
# Add the new value to the array and increment the count
values[NR % window_size] = $1
count++
# Calculate the sum of the current window
sum = 0
for (i = 0; i < window_size; i++) {
sum += values[i]
}
# If we have at least 'window_size' elements, print the moving average
if (count >= window_size) {
print sum / window_size
}
}
Amazonで買った地磁気センサ Youmile GY-273 QMC5883L による地磁気計製作備忘録.総集編2024-05-15
Note of geomagnetic sensor Youmile GY-273 QMC5883L from Amazon. General review 2024-05-15
このセンサは情報が多いハネウェル製のHMC5883Lに似せているが,互換チップではないようで,異なる石でとても情報が少ない.数少ない情報からとりあえず次の方法で観測可能な手段を見つけた.
This
sensor is similar to Honeywell HMC5883L which has a lot of information,
but it is not a compatible chip and has very little information on
different tips. I found a method to use it in the following way.
購入元 Source of purchase
https://www.amazon.co.jp/gp/product/B091YNR6F3/
なおAmazonの基板にはHMC5883Lと書かれているがこれはFakeで実際には異なる.このあたりは下記を参照.
The board from Amazon says HMC5883L, but this is a fake. See below the video for more details.
https://www.youtube.com/watch?v=Ndtg6WKLXYE
色々と試行したが結局,下記のサイトの記述を参考にする.このサイトの参考ライブラリのコードで文字化けしたのはシリアル通信の速度が速かったため.これを9600に落として無事走った.
After various attempts, I finally decided to use the description at the following site as a reference. At first it does not work, then I dropped it to 9600 from the high speed via serial port and it ran without trouble.
https://leico.github.io/TechnicalNote/Arduino/esp32-qmc5883l
このサイトにあるリンクから,QMC5883_readRawとQMC5883_compass をベースとする.ここまで時間がかかった.ここではQMC5883_readRawをArduinoIDEで起動して観測する.
From the links on this site, you can find
QMC5883_readRaw and QMC5883_compass as a base. It took me a while to get to this point. Here, QMC5883_readRaw is started with ArduinoIDE and observed.
Arduinoとの接続図は以下のとおり.The connection diagram with Arduino is as follows.
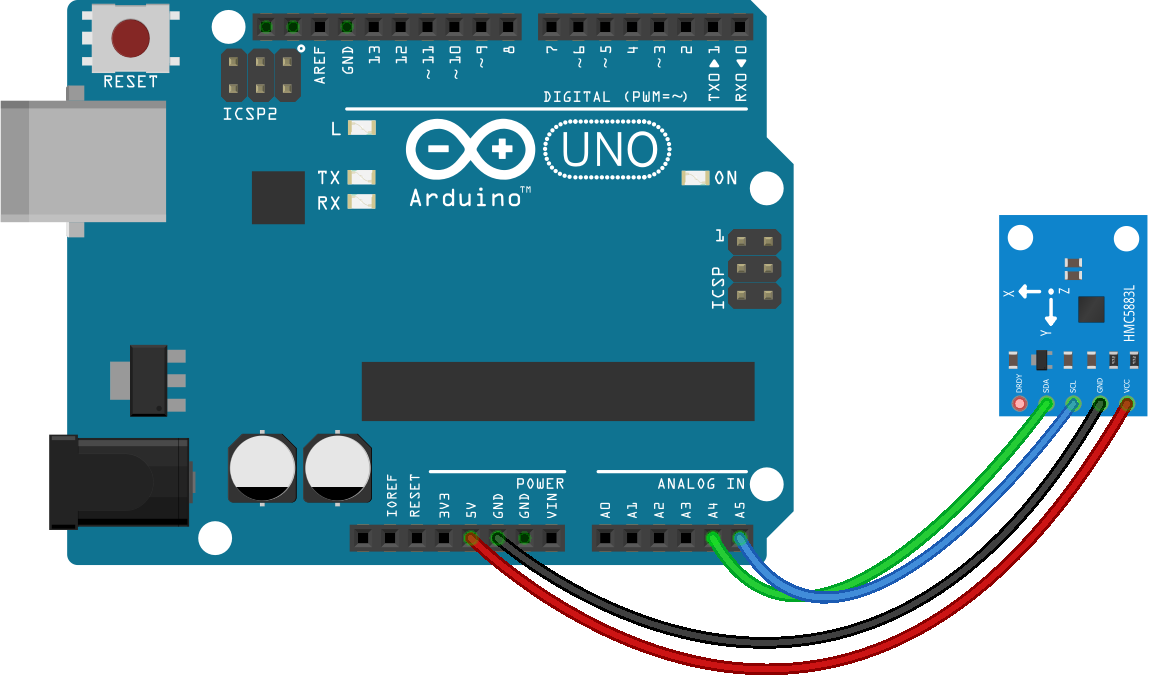
https://www.circuitbasics.com/how-to-setup-a-magnetometer-on-the-arduino/
ソフトウエア.ArduinoIDE上でのスケッチ.なお必要ライブラリなどは各自,QMC5883LとArduinoで検索して探してほしい.
筆者の用いているスケッチは以下のとおり.これで一応データ取得ができる.
My sketch on ArduinoIDE. Please search QMC5883L and Arduino for necessary libraries.
My sketch is use to get data as follows. This is enough to this study.
/*!
* From http://osoyoo.com/driver/DFRobot_QMC5883.zip
* @file QMC5883_readRaw.cpp
* @brief show raw data
* @n 3-Axis Digital Compass IC
*
* @copyright [DFRobot](http://www.dfrobot.com), 2017
* @copyright GNU Lesser General Public License
*
* @author [dexian.huang](952838602@qq.com)
* @version V1.0
* @date 2017-7-3
* Modified by Yoshio Okamoto 2024-05-13
*/
#include <Wire.h>
#include <DFRobot_QMC5883.h>
DFRobot_QMC5883 compass;
int minX = 0;
int maxX = 0;
int minY = 0;
int maxY = 0;
int offX = 0;
int offY = 0;
void setup()
{
Serial.begin(9600);
// Initialize Initialize QMC5883
while (!compass.begin()){
Serial.println("Could not find a valid QMC5883 sensor, check wiring!");
delay(500);
}
if(compass.isHMC() ){
Serial.println("Initialize HMC5883");
compass.setRange(HMC5883L_RANGE_1_3GA);
compass.setMeasurementMode(HMC5883L_CONTINOUS);
compass.setDataRate(HMC5883L_DATARATE_15HZ);
compass.setSamples(HMC5883L_SAMPLES_8);
}else if(compass.isQMC()){
Serial.println("Initialize QMC5883");
compass.setRange(QMC5883_RANGE_2GA);
compass.setMeasurementMode(QMC5883_CONTINOUS);
compass.setDataRate(QMC5883_DATARATE_50HZ);
compass.setSamples(QMC5883_SAMPLES_8);
}
}
void loop()
{
Vector mag = compass.readRaw();
Serial.print(mag.XAxis);
Serial.print(":");
Serial.print(mag.YAxis);
Serial.print(":");
Serial.print(mag.ZAxis);
Serial.print(":");
Serial.print(sqrt(mag.XAxis*mag.XAxis+mag.YAxis*mag.YAxis)); //Horizontal Comp.
Serial.print(":");
Serial.println(sqrt(mag.XAxis*mag.XAxis+mag.YAxis*mag.YAxis+mag.ZAxis*mag.ZAxis)); //Total magne
delay(920); // adjust to 1Hz sampling
}
筆者自宅(木造家屋2Fの書斎)の机上に置いた,観測機の全景は以下のとおり.特に磁気に関する特別の配慮はしていない.
The following is a general view of the observation equipment on the desk in my home (the second floor of a wooden house). No special consideration is given to magnetism.
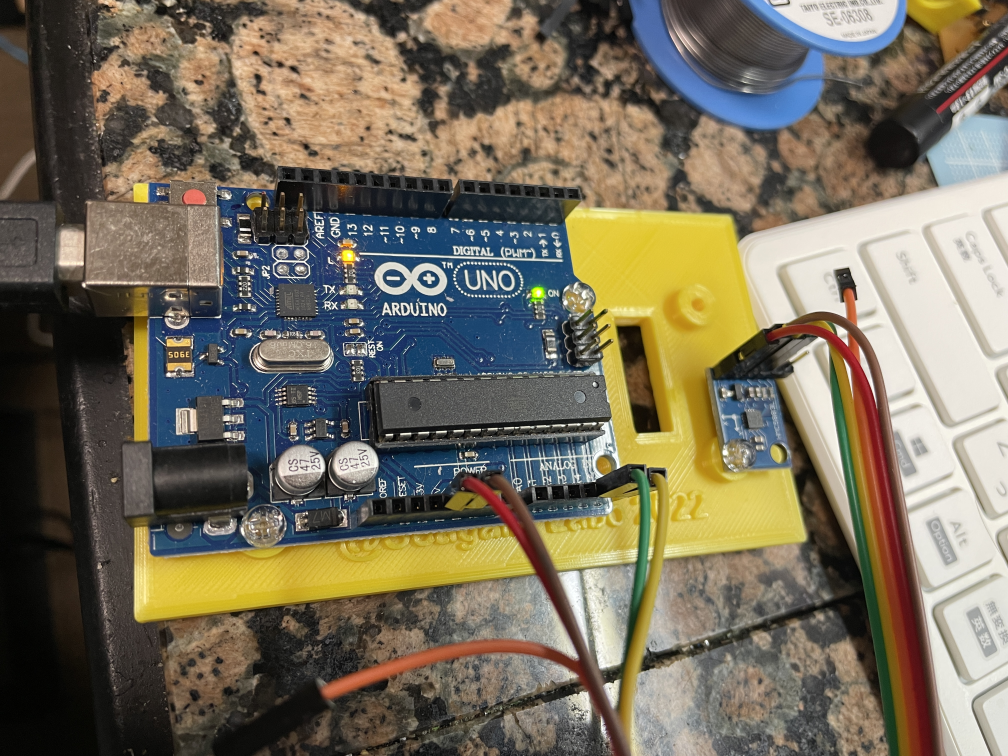
観測機の全景 The observing board
観測機周りの様子.基板が動かないように石で押さえている.
An environment around the gadget. The board is held by a stone to prevent moving.
<参考サイト>
<Reference site>
http://osoyoo.com/ja/2017/09/14/qmc5883l-electronic-compass-for-arduino/
https://docs.sunfounder.com/projects/elite-explorer-kit/ja/latest/basic_projects/09_basic_gy87_qmc5883l.html
など多数.
びCopyright(c) by Y.Okamoto 2024, All rights reserved..