Simulation for Classroom Page
Yoshio Okamoto 5th May 2020 (Stay home programing Series No.1-3 from my FaceBook)
2. COVID-19 infection
My recent interest in this topic is how to use modifying my "Go-game model" as an infection simulation on COVID-19 infection.
About Go-Game model
This model was introduced to explain the famous Gutenberg-Richter's Law by M.Otsuka(1971, in Japanese)
https://www.jstage.jst.go.jp/article/zisin1948/28/1/28_1_96/_pdf/-char/ja
This model was used as an education tool of earthquakes at Yokoyama Highschool in 1990 by Dr.M.Matsuzaki.
I slightly modified the Dr.Matsuzaki's teaching model, Okamoto (1997, in Japanese).
Numerical Models based on an approach of“Complexity”for
Geoscience classes, GeoSciEdIV Cargary 2003 proceedings,171-172
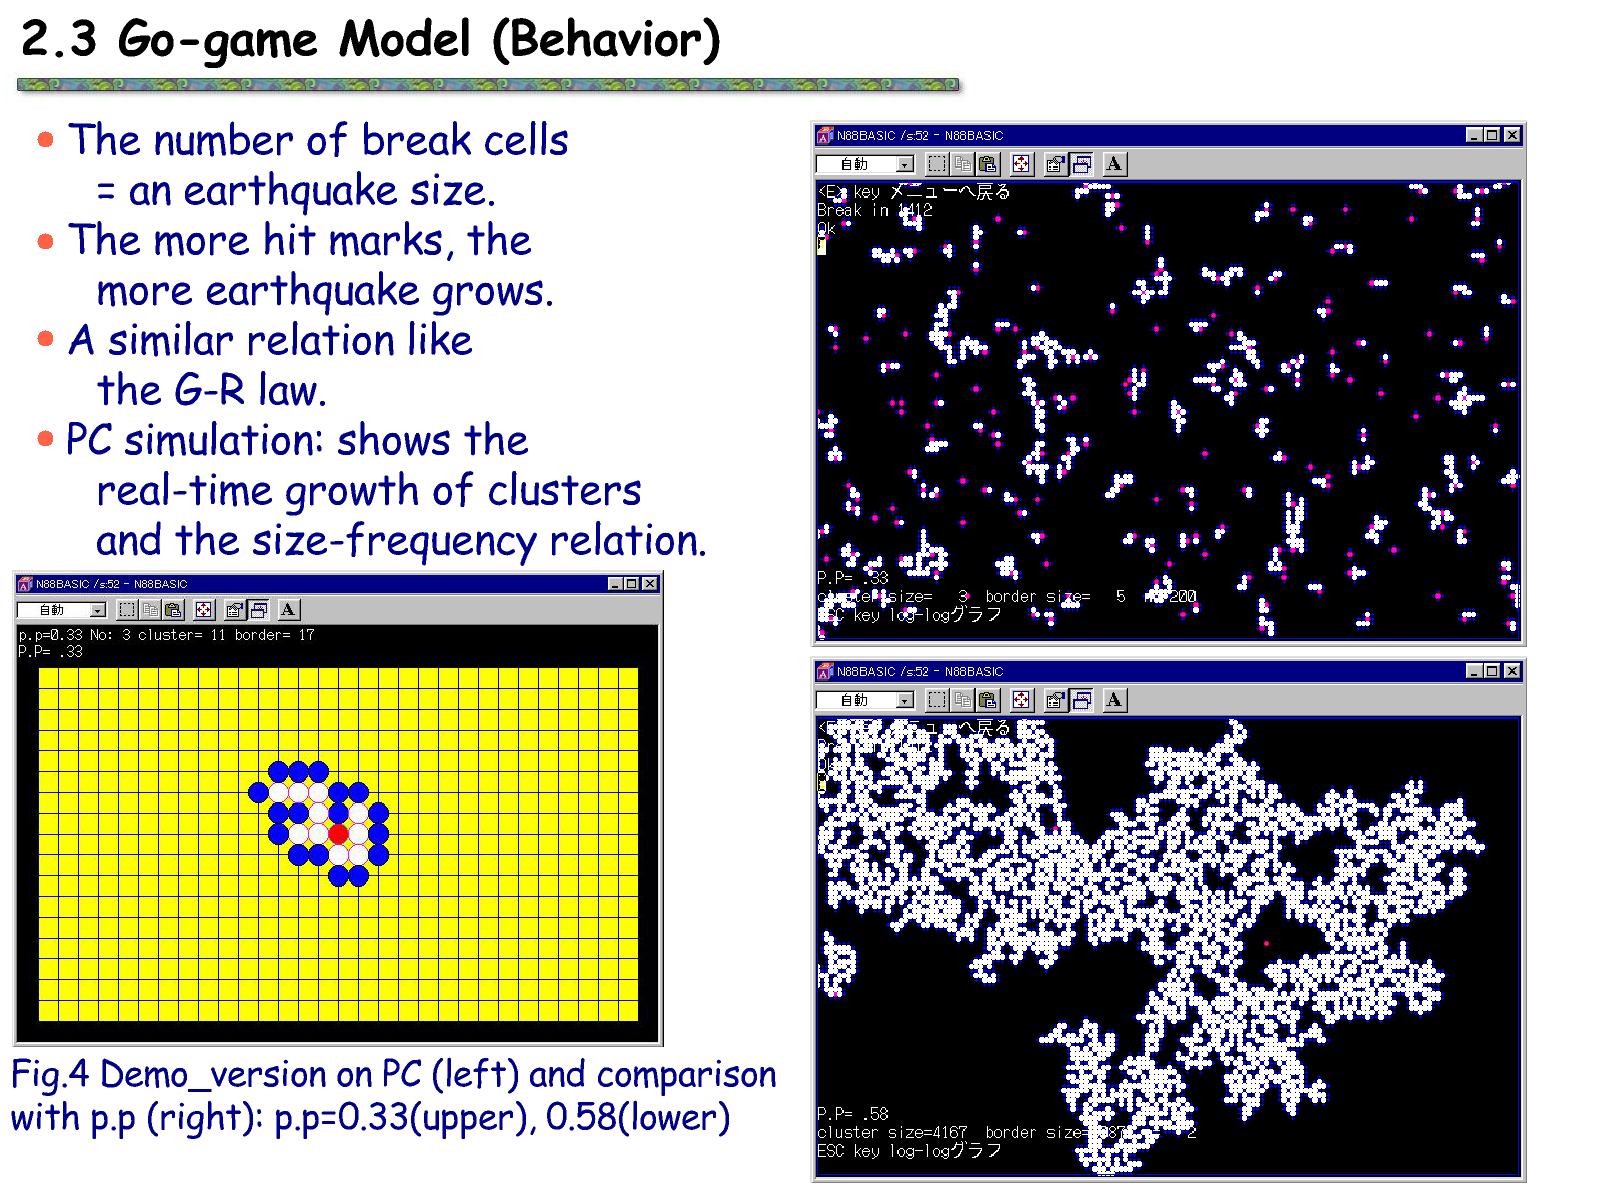
One month ago, a data scientist commented the COVID-19 infection behaves like the percolation model.
https://www.fttsus.jp/covinfo/remarkable-comments/ (in Japanese)
Go-game model and percolation theory by Otsuka 1974 (in Japanese)
https://www.jstage.jst.go.jp/article/zisin1948/28/1/28_1_96/_pdf/-char/en
So, at first, I modified my Go-Game model from BASIC to Processing coding.
Then, I made new programs based on my Go-game model to explain the
static behaviors of COVID-19 infection compared with theoretical
estimation.
Here, from my FaceBook,
For Thai students and teachers, here is my COVID-19 infection simulation
running on Processing. The algorithm is from the following site,
https://rad-it21.com/サイエンス/michikoshi-shugo_20200331/
Sorry, this site is only in Japanese.
You can download my program from my web site,
http://yossi-okamoto.net/programs/Corona_Sim_ST3.pde
(new version including void effect, parameter VP is as follows)
http://yossi-okamoto.net/programs/COVID_19_ST.pde
Also you need to install Processing platform from here,
https://processing.org/
You can run this program under your choice of parameters. Particularly, IP (infection probability) and RP (recovery probability) are important to study the behavior of the infection process. This is a typical cell automaton and can easily make general
epidemic curves from its .csv files using Excel or Calc. Please see the
images in the previous Japanese version. If you have any questions,
please let me know!
The algorithm is as follows,
<Non-void model> all sites are occupied by an agent.
1) Space is divided into 100x100 grids.
2) Initially, infected agents (= 100) are also distributed randomly (purple color).
3) Not infected (susceptible) agents are tested to contact surrounding four neighboring sites,
4) if they contact to infected agents, then tested their infection with probability IP. If they infected, then the site color changes to blue.
5) This process is iterated for all not infected agents
6) The infected agents recover with recovering probability RP coloring green
7) The recovered agents are never tested.
8) This process ( 3) to 7) ) is iterated until TMAX.
9) Window images and the number of agents are recorded as image files and a csv file, respectively.
.
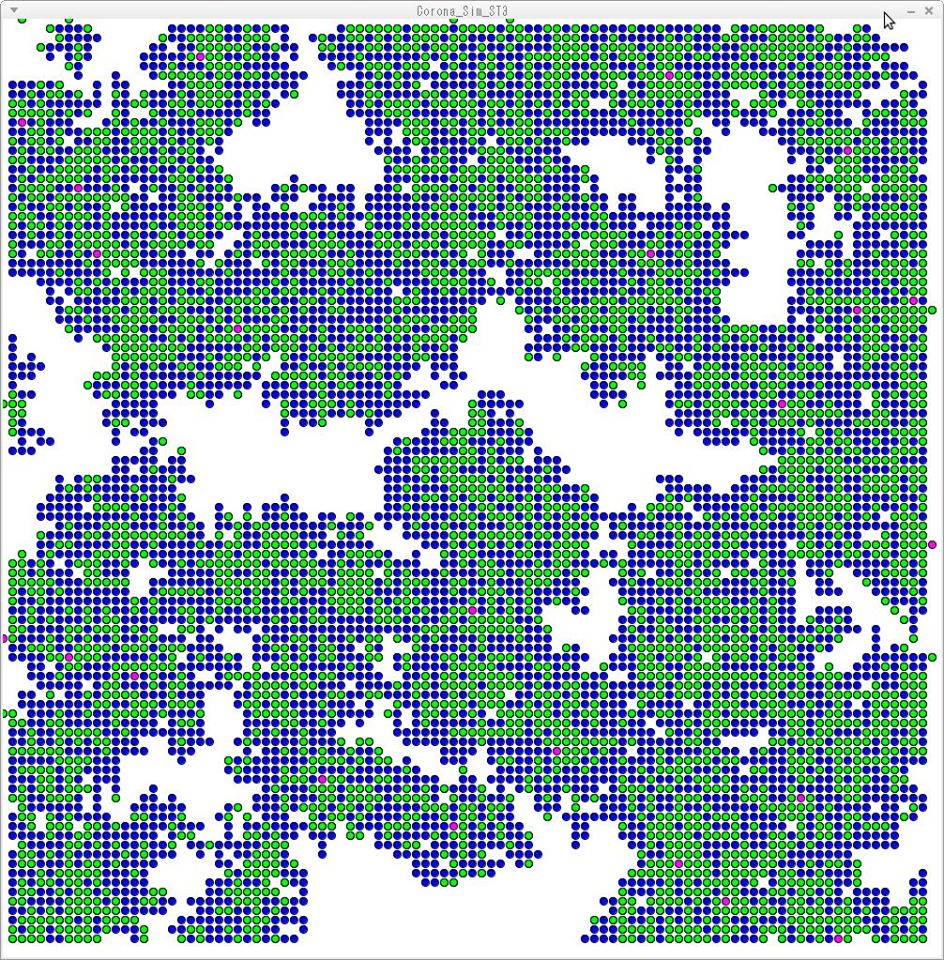
Relatively
high infection rate and moderate recovery rate (IP=0.25, RP=0.05).
Purple grids show the initial infected. Blue is now infected. Green
shows a recovered and immunize grid.
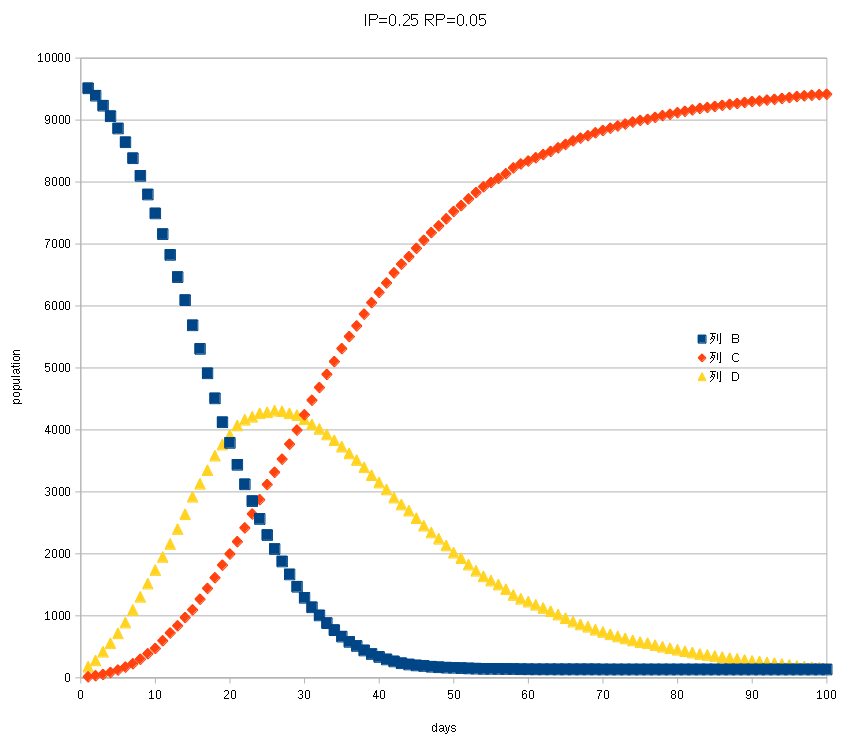
blue plot: not infected (susceptible) yellow: now infected orange: already recovered.
After
100 steps ( = 100 days afer) , You can see most of all not infected
agents are infected within 30 days and are recovered after 60 days.
These results strongly agree with the SIR epidemic model suggesting.
https://scipython.com/book/chapter-8-scipy/additional-examples/the-sir-epidemic-model/
<Void model>
1) A space is divided 100x100 grids.
2) Not infected agents (human, green color) are distributed randomly with probability (1-VP). VP is void probability (Void color is white.).
3) Initial infected agents (= 100) are also distributed randomly (purple color).
4) A not infected (susceptible) agents are tested to contact surrounding four neighboring sites,
5) if they contacts to infected agents, then tested their infection with probability IP.
6) This process is iterated all not infected agents.
7) The infected agents recover with recovering probability RP coloring green
8) The recovered agents are never tested.
9) This process ( 3) to 7) ) is iterated until TMAX.
10) Window images and the number of agents are recorded as image files and a csv file, respectively.
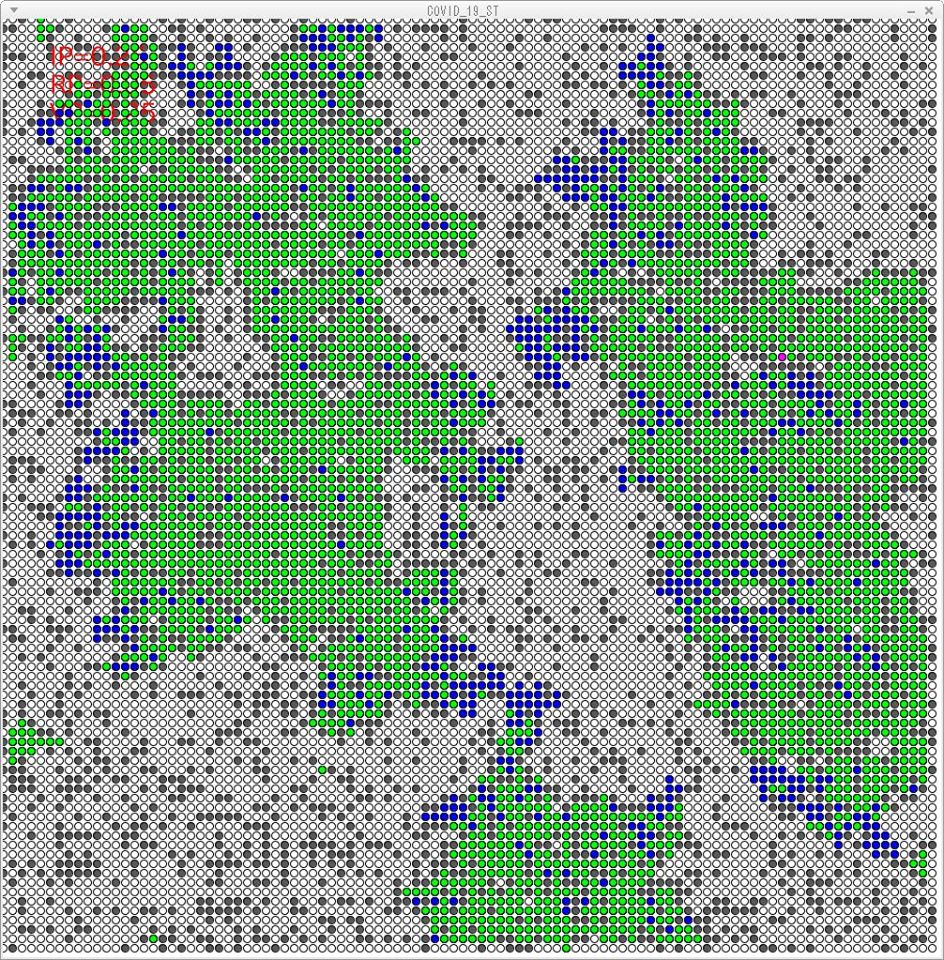
IP=0.25,RP=0.05 and VP=0.25 20 steps after ( = 20 days)
The graph is
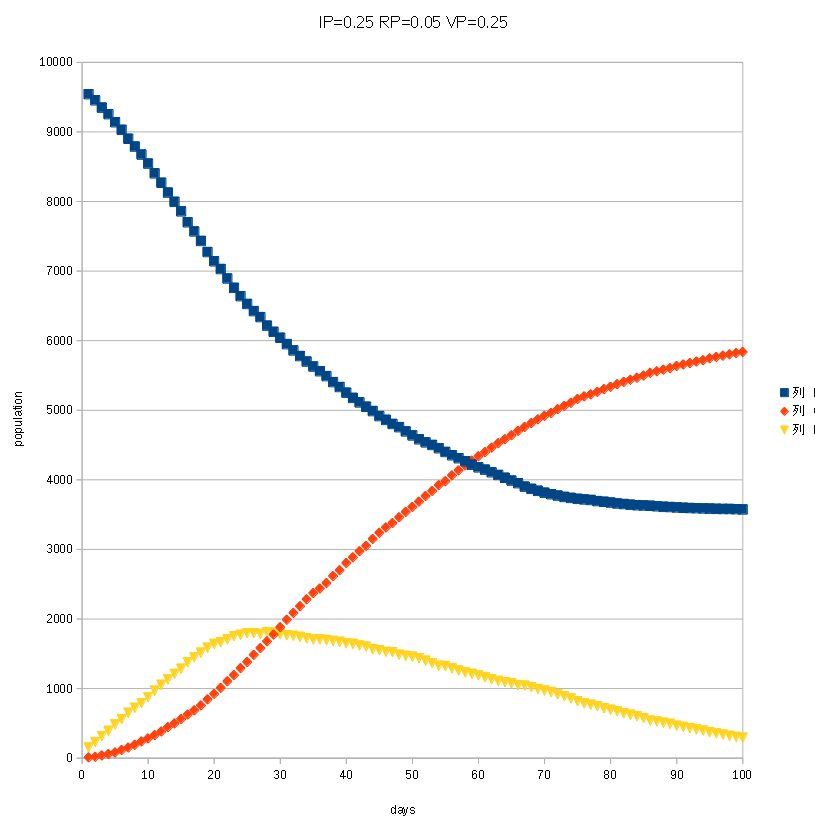
if 25% of space are void, then the infected agents rate is lowered about 60%.
It means the space is very important to prevent rapid pandemic.
<Moving people mode>
This simulation adds the effect of people moving.
This algorithm is a little bit difficult to build.
Because to add the moving agents effect is a tough work for me.
I tried some models to add this effect, finally I got a random walk model of agents.
I introduce moving probability MP.
The moving process of agents are taking place at random with MP on each iteration step.
At first I will show you no moving calculation snapshot
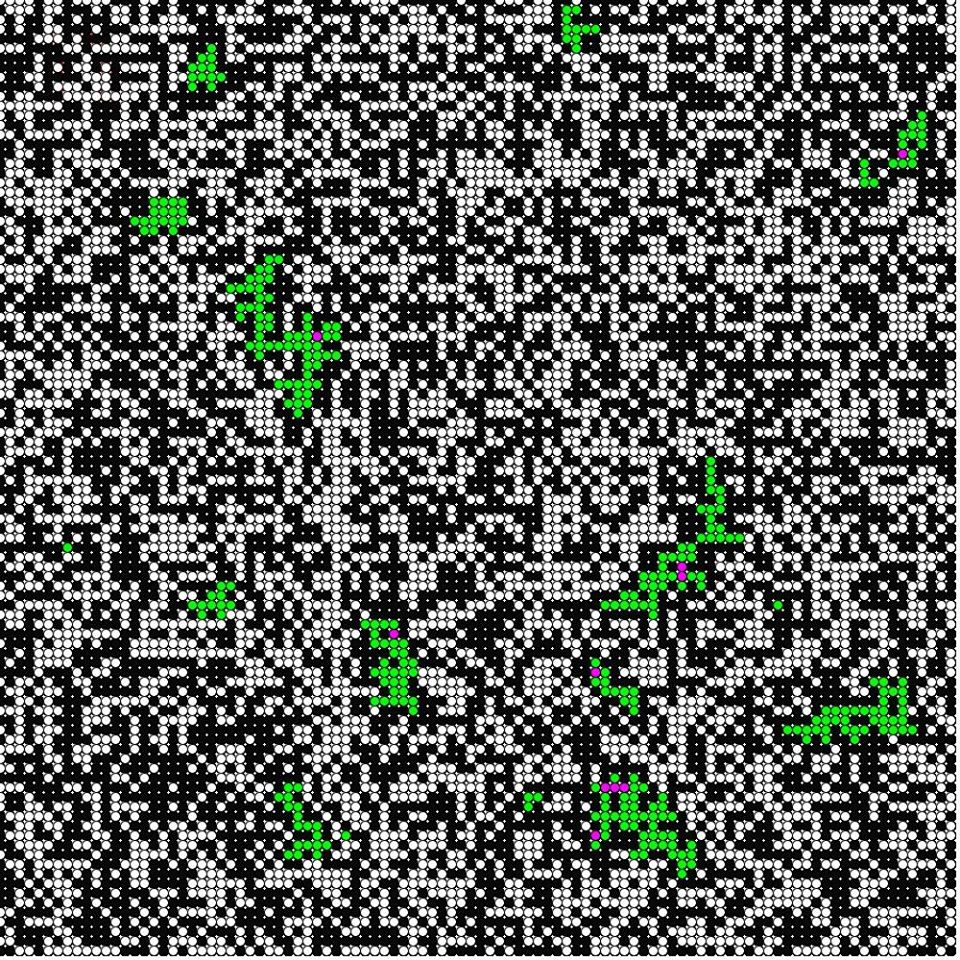
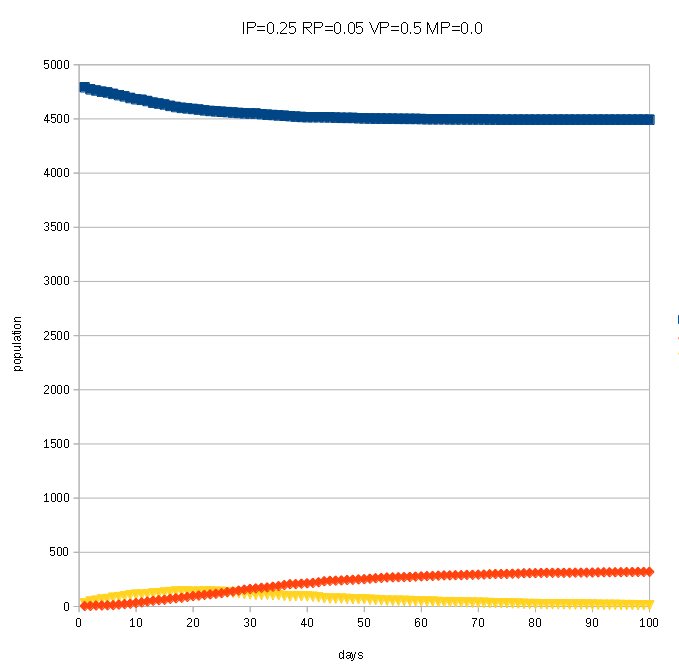
RP=0.05, VP=0.5 and MP=0.0 initial infected is 20 after 100 steps (days)
The whole infection is decreasing, and looks go to end.
Next, moving mode with MP = 0.05 at total grids not agents
It means 10% of agents are moving at each steps.
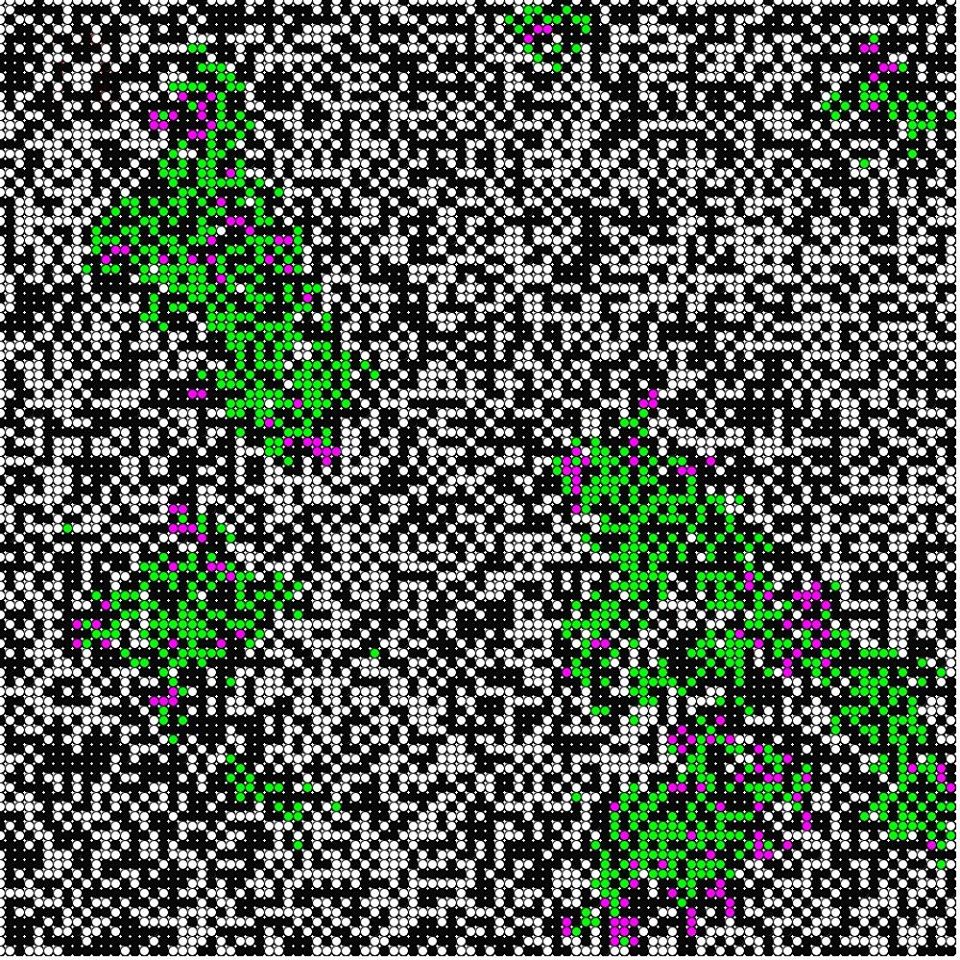
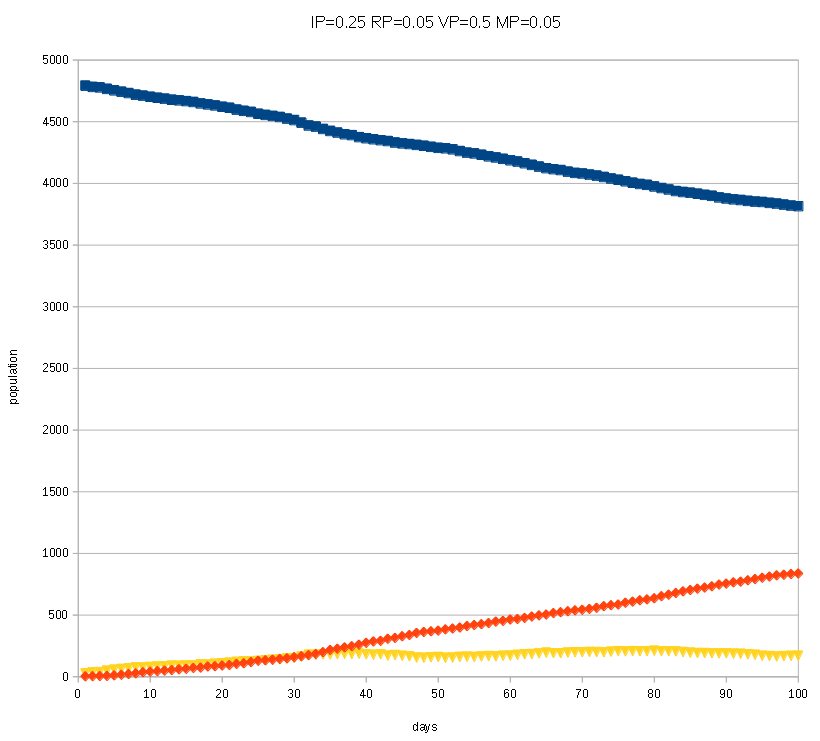
Infected agents are increased (purple color, sorry color is changed from blue at previous version)
And the pandemic does not end.
Finally, more people moving mode,
MP = 0.25 at total grids,
It means 50% of agents are moving each time step (after 100 steps)
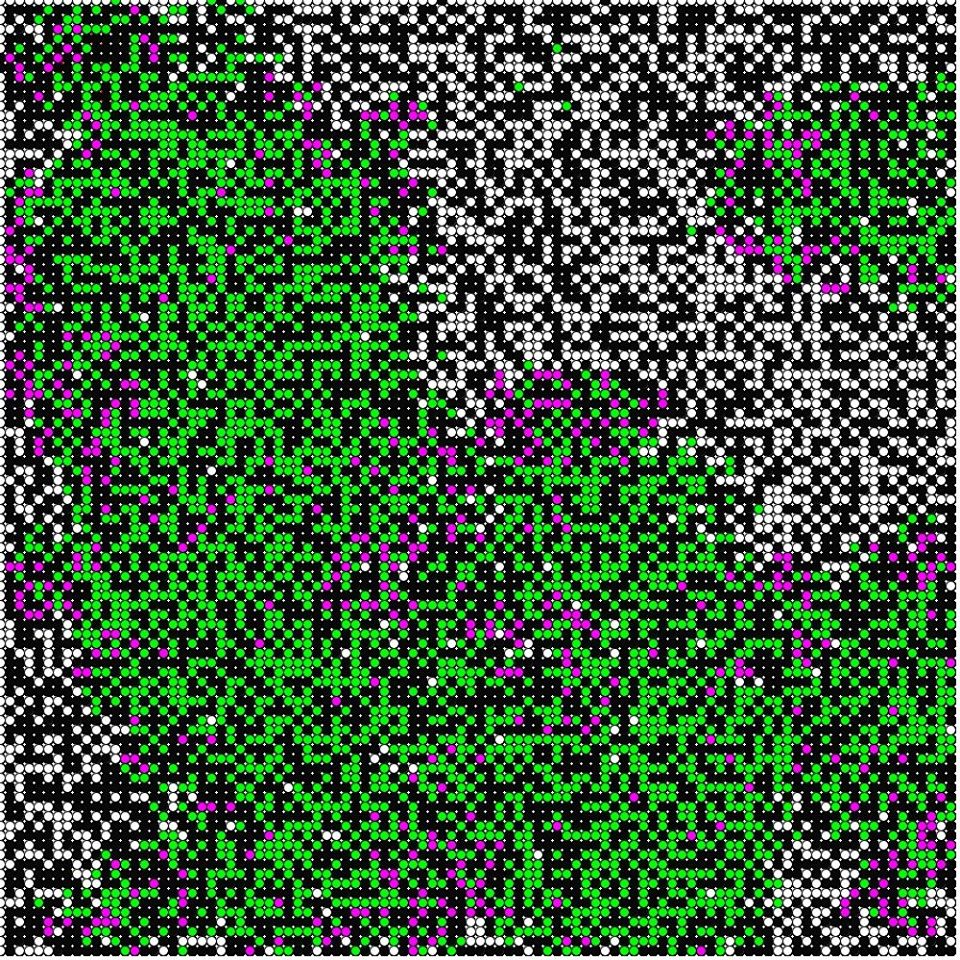
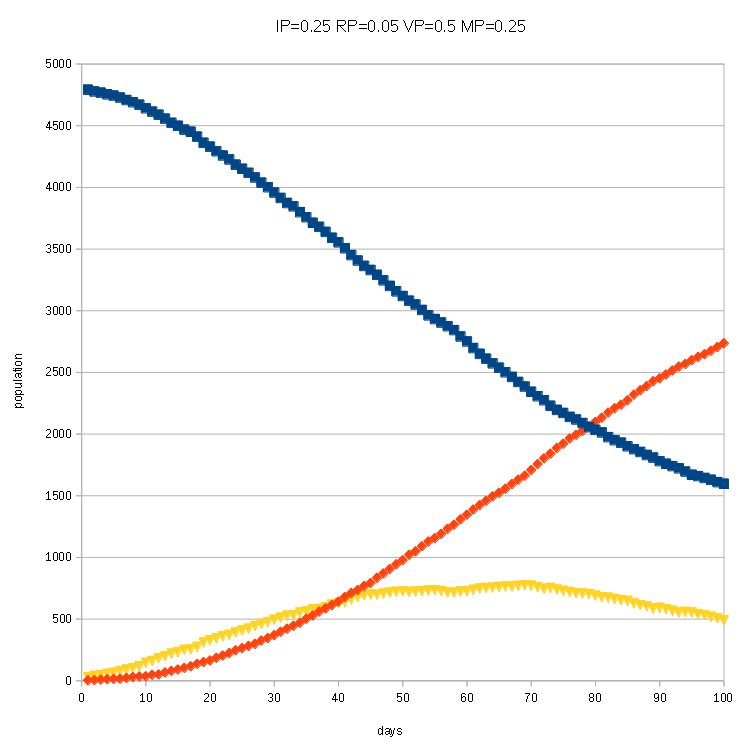
You can see more people are infected (pandemic happens!) and the rate is not getting down.
Conclusion:
My simulations are very simplified and calculated under many limited assumptions,
However, they suggest the importance of avoiding crowded people,
and do not move around in the city area to prevent people contact.
So, Please Stay Home!!
Copyright(c)
by Y.Okamoto 2020, All rights reserved.


