巣ごもりプロジェクトその1.感染シミュレーションプロトタイプ FaceBookに5月に書いた記事を載せます.何かの参考に Yoshio Okamoto 14th July 2020, 12th Oct. 2023

(3rd Jan.2021 グラフの色をシミュレーションに合わせて変更しました.12 Oct. 2023 英語版を少し追加しました.)

Stay home (Nesting) project part 1. infection simulation prototype. I wrote an article about this project in May on FaceBook. For your reference 14th July 2020
(3rd Jan. 2021 I changed the color of the graph to match the simulation. (English version version is translated with DeepL site, and slightly modified.)


先週,春休みの学生さん向けの宿題として「感染シミュレーション」の記事を紹介しました.
https://rad-it21.com/サイエンス/michikoshi-shugo_20200331/
このところの巣ごもり状態で家で暇なので,昨日からプログラミングで遊んでいました.以前に紹介した碁石モデル(大塚,1971)の改良ではなく,紹介記事のアルゴリズムで スクラッチからprocessingコードを書きました.一応走るようになったので,少し例を紹介します.記事にあった感染率高の例は,記事のパラメータ では実現できず,少し異なった値になりました.同様に記事にあった中感染度,低感染度の例と似たものを作ってみましたが,パラメータはかなり異なります. 私の計算論理と感染コンタクトの部分の設計が異なるのかも知れません.ただ,この記事の例にある動くプログラミング画面の感染状況は,かなり感染度が高い のでα=0.1程度では実現できないのではと思っていますが,私のプログラムのバグかも知れません.
興味ある方に私のプロトタイプを下記に起きましたので,ご自分で試してみてください.なお,本家Processing言語のインストールが必要です.
https://processing.org/
私はLinux上で実行していますが,WindowsやMacでも動くはずです.下記プログラムをProcessingの画面にコピーペーストして実行ボ タン(右向き三角印)を押すだけで実行するはずです.グラフは同時に書き出されるcsvファイルからExcelやcalcで作れます.パラメータを色々と 変えて試行してみてください.なお私は元BASICプログラマなので変数などの扱いは超テキトーです.あしからず.
http://yossi-okamoto.net/programs/Corona_Sim_ST3.pde
4/14追記.感染症シミュレーションと「碁石モデル」の関係について,本質的にパーコレーションの問題に帰依するという情報科学の専門家の指摘がある(「碁石モデル」は本質的にパーコレーションと等価であるとされる).
https://www.fttsus.jp/covinfo/remarkable-comments/

Last week, we introduced an article on "Infection Simulation" as a homework assignment for students during spring break.

https://rad-it21.com/サイエンス/michikoshi-shugo_20200331/

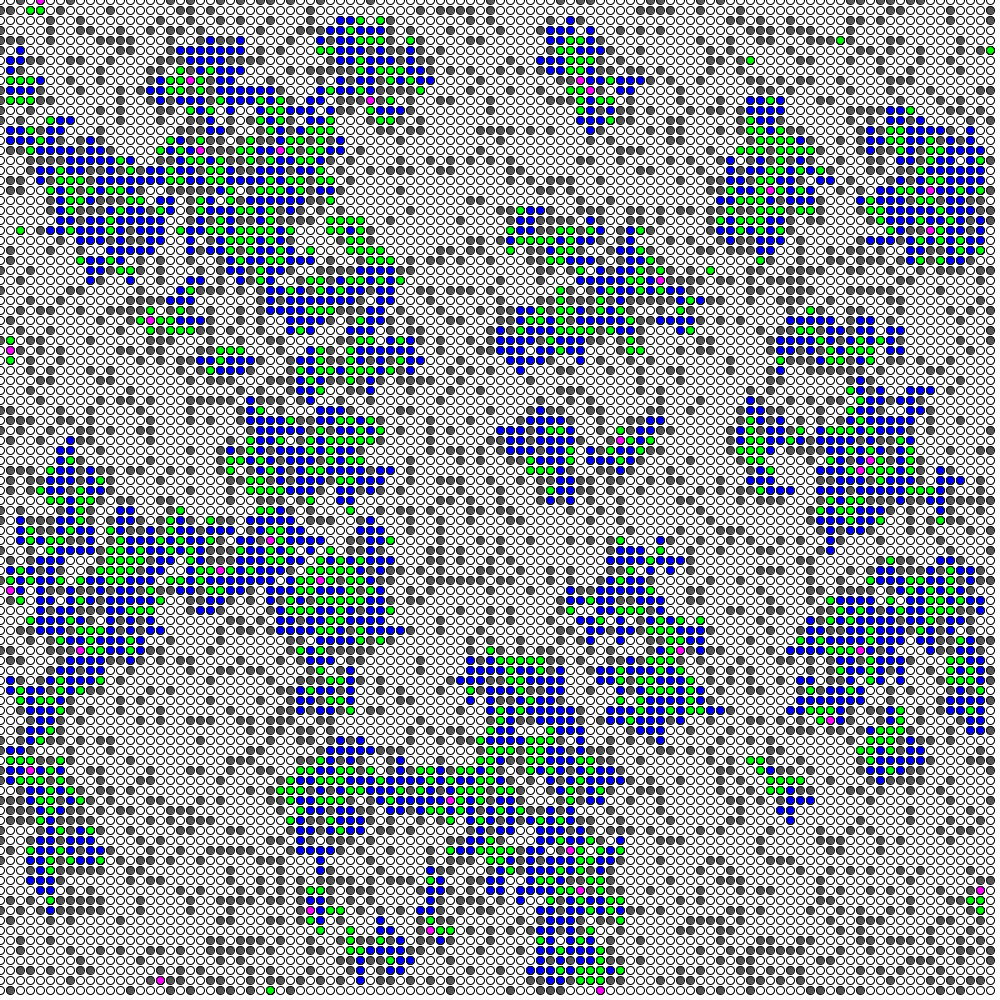
I have been playing with programming since yesterday. Instead of improving the "Go-Game model" (Ohtsuka,1971) I wrote a processing code from scratch using the algorithm in the above article. Now that I have it running, I would like to show here a few examples. The high infection rate example in the article could not be realized with the parameters in the article, and the values are slightly different. Similarly, I tried to create an example similar to the medium and low infectivity examples in the article, but the parameters are quite different. It may be that my calculation logic and the design of the infection contact part are different. However, the infectivity of the moving programming screen in the example in this article is quite high, so I think it cannot be realized with α=0.1, but it may be a bug in my program.

For those who are interested, I have prepared my prototype below, so please try it yourself. Please note that you need to install the original Processing language.

https://processing.org/

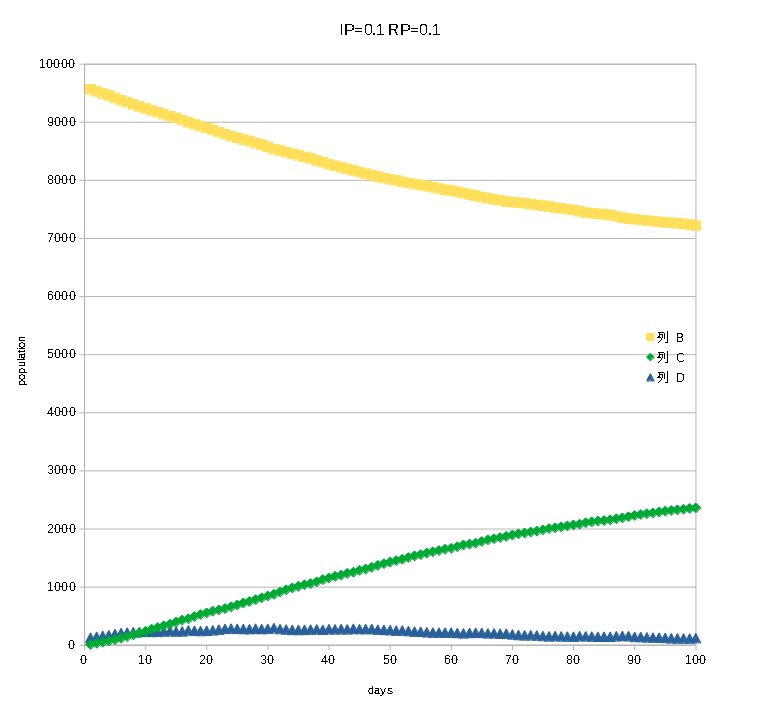
I am running it on Linux, but it should also work on Windows and Mac. Simply copy and paste the following program into the Processing window and press the Run button (right-facing triangle). Graphs can be created in Excel or calc from the csv file that is exported at the same time. Experiment with various parameters. Note that I am a former BASIC programmer, so I am not familiar with variables. I am a former BASIC programmer, so I am not very good with variables, etc.

http://yossi-okamoto.net/programs/Corona_Sim_ST3.pde

4/14 addition. There is a point by an information science expert that the relationship between simulation of infectious diseases and the "Goishi Model" essentially depends on the problem of percolation (the "Goishi Model" is said to be essentially equivalent to percolation).

https://www.fttsus.jp/covinfo/remarkable-comments/

For Thai students and teachers, here is my COVID-19 infection simulation running on Processing. The algorithm is from the following site,
https://rad-it21.com/サイエンス/michikoshi-shugo_20200331/
Sorry, this site provides only in Japanese.
You can download my program from my web site,
http://yossi-okamoto.net/programs/Corona_Sim_ST3.pde
(new version including void effect, parameter VP is as follows)
http://yossi-okamoto.net/programs/COVID_19_ST.pde
Also you need to install Processing platform from here,
https://processing.org/
You can run this program under your any choice of parameters. Particularly, IP (infection probability) and RP (recovery probability) are important to study the behavior of infection process. This is a typical cell automaton and can make easily general epidemic curves from its .csv files using Excel or Calc. Please see the images in the previous Japanese version. If you have any questions, please let me know!


感染度を高く設定して(IP=0.25,RP=0.05
)走らせた途中の状態.紫の点が最初の感染者,青は感染中,緑が快復して免疫を持った状態.なお記事のαを私のプログラムではIP,γをRPで置き換えている.
Relatively high infection rate and moderate recovery rate (IP=0.25, RP=0.05). Purple grids show the initial infected. Blue is now infected. Green shows a recovered and immunize grid.


100ステップ後のグラフ.人数は100×100の格子で計算.しかし周期境界条件は入れていない.従って端のデータを含んでいないので,初期人数は10000人よりも少ない.青色が感染者.黄色が非感染者,緑が快復者(免疫獲得者).単位時間を仮に1日とすると100日分の計算になる.記事では確率をどちらも0.1に設定しているが,私の計算ではアルゴリズムが異なるので,その記事のグラフは実現できない.

Graph plot after 100 steps(100days).
The number of people is calculated on a 100 x 100 grid. However, periodic boundary conditions are not included. Therefore, the initial number is less than 10000 because the end data are not included. Blue: infected persons. Yellow are the non-infected (white circles above chart), and green are those who have recovered (acquired immunity). Assuming that the unit time is one day, the calculation is for 100 days. In the reference article, the probability is set to 0.1 for both cases, but the reference paper graph is not reproduced in my calculations. Because of the difference of the basic algorithms.


記事にある感染度中の状態の再現.IP=0.5 RP=0.08でかなり近い状態になる.

Reproduction of the middle infection parameter in the article during infection: IP=0.5 RP=0.08, which is quite close to the condition in the article.


記事にある感染度高のパラメータ(感染,快復確率いずれも0.1)ではこのような感染度がかなり低い状態のグラフになった.
The high infection parameter in the article (0.1 for both infection and recovery probability) resulted in this graph with a much lower infection level in my caliculation.

写真の説明はありません。

Processingプログラム画面はこんな感じ.左上の右向き三角で実行できる.

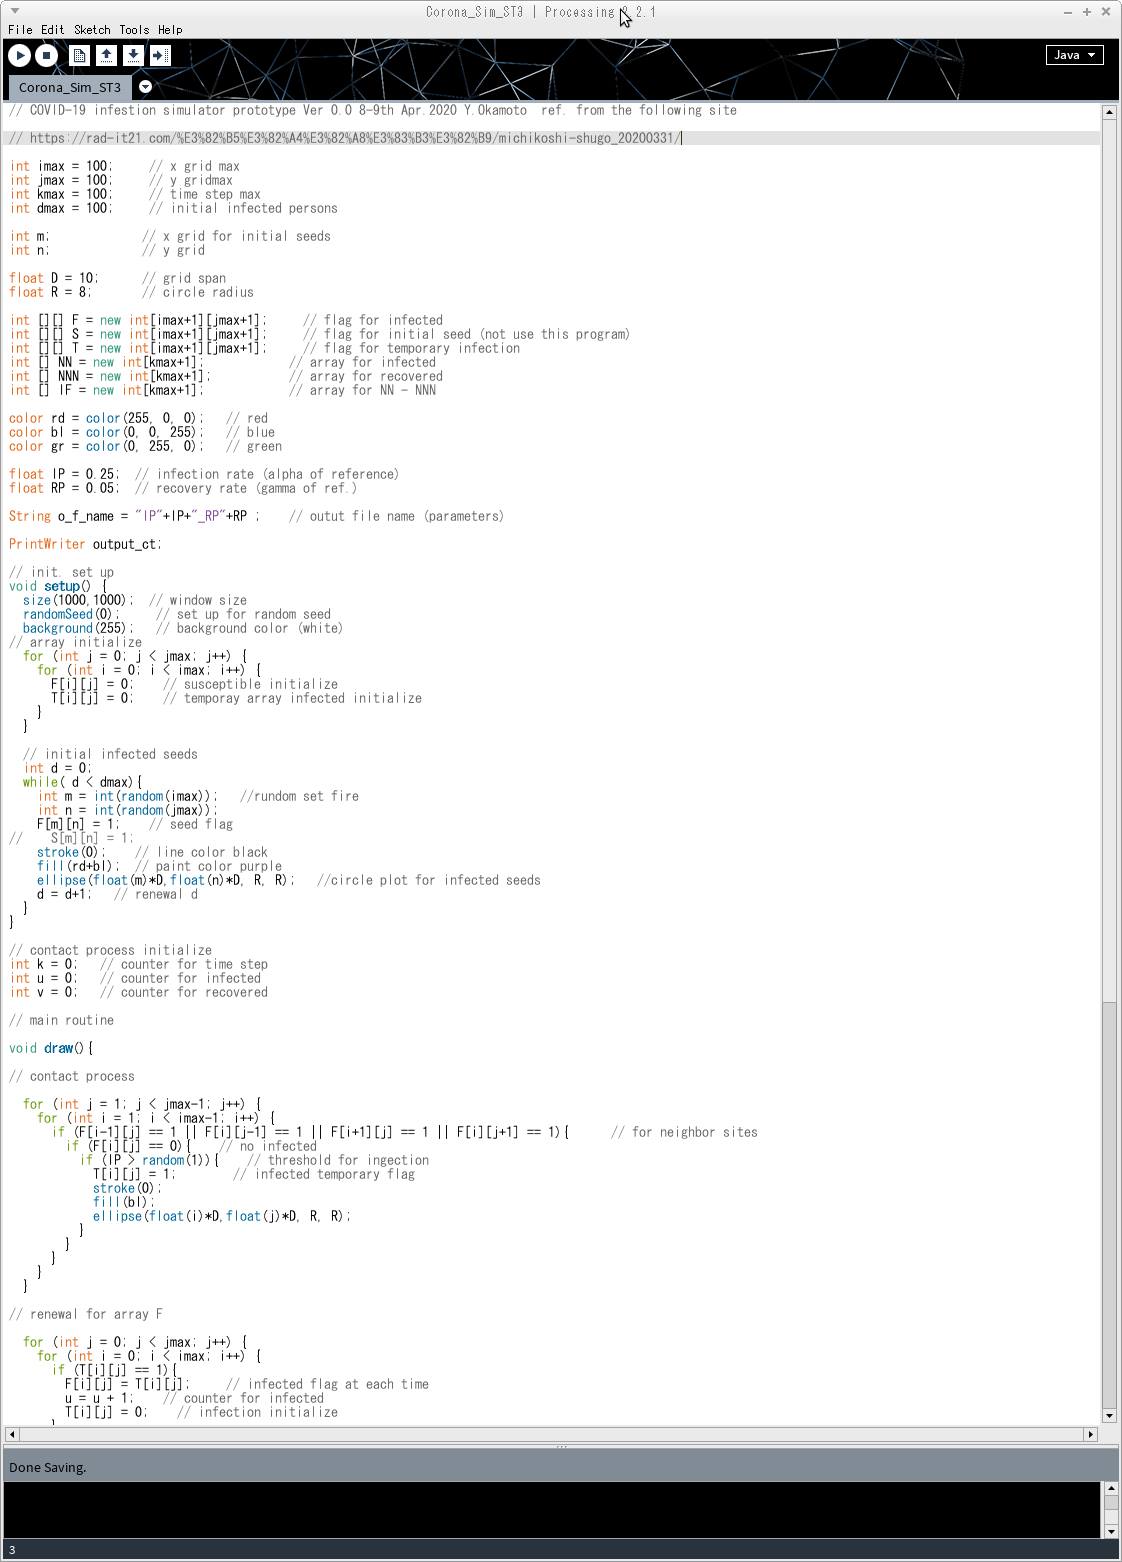
The Processing program screen looks like this. The right-pointing triangle in the upper left corner runs the program.


Copyright(c) by Y.Okamoto 2020, All rights reserved.