感染確率(感染者が1日のうちにほかの人にうつす確率)
Nestling Project Infection Simulation Part 3. I posted the article in May on FaceBook. For your reference 14th July 2020, 17th Apr.2021, revised on 26th Feb. 2024, particularly about colors.
At the bottom of this page, I posted a method for saving a sequence of images and making a movie from them using Processing. This is very useful. It may be helpful for those who have difficulties in saving and creating simulation movies in their research. 17th Apr.2021
(The color of the infected person in Part 1 and 2 was blue, but here it has been changed to red-purple).
エー
ジェントが移動する場合の計算の試作に取り組んでいました.この格子にいる人(複雑系科学ではagentと呼ぶ)をランダムに移動させた場合を考えます.
参考記事にも最後にこの計算が載っています.これ先週からアルゴリズムを考えていたのですが,結構大変でした.最初様々な移動のアルゴリズムを考えては計
算し,バグが見つかり,また別のアルゴで計算の繰り返しでした.やっと満足のいく試作ができました.まだバグがあるかも知れませんが,少し公開します.感
染症の専門家が人が移動して接触することの危険性をさかんに訴えていますが,それが簡単なモデルで実証できます.計算上の100日後の画像とグラフをどう
ぞ.動画も追加しました.
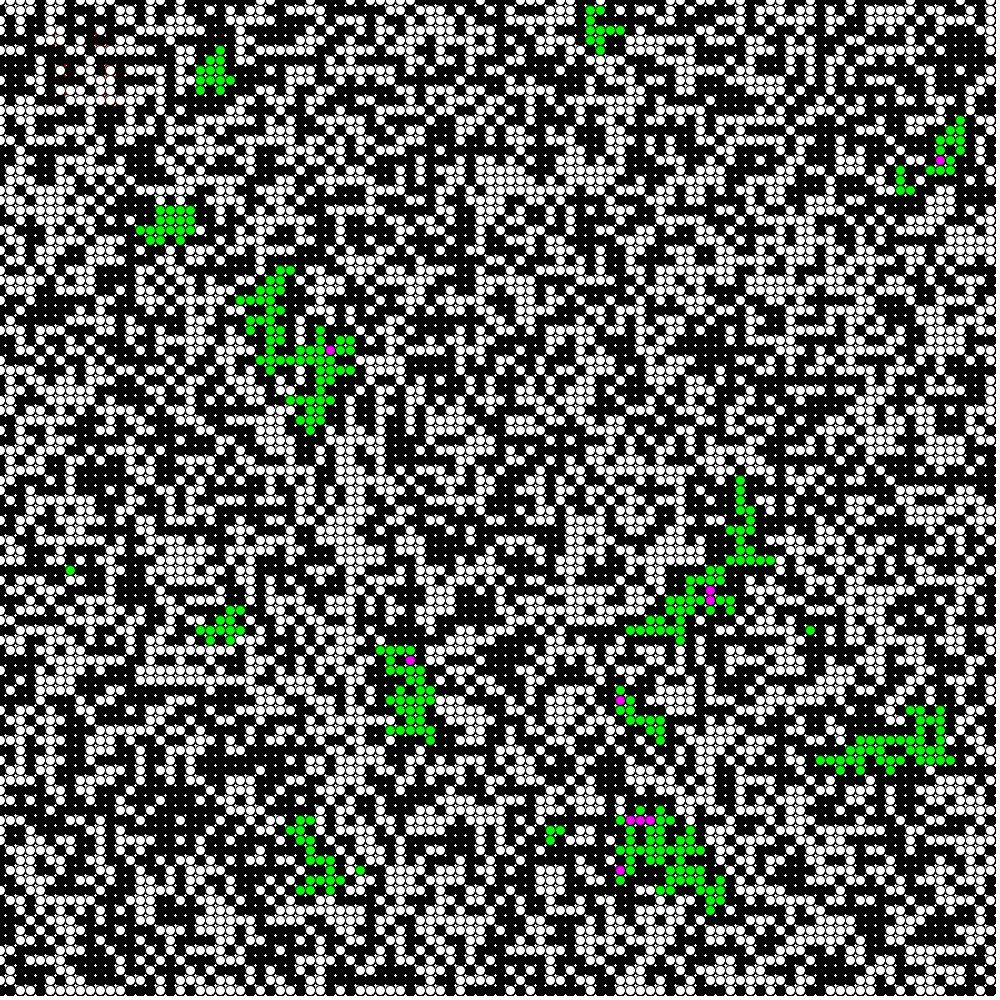
画像では白が非感染者,黒が空隙,紫が現在の感染者.緑が感染後すでに免疫を獲得した人です.移動は格子上の人がある確率MPで移動しま
す.MP=0.25ということは1計算単位(この場合は1日)につき,全体の25%の人がランダムに選ばれて,ランダムな方向(東西南北)に格子1つ分だ
け移動します.この確率は格子全体に対する確率です.その他は前の計算と同じ条件です.グラフは黄色のグラフが非感染者数の推移.紫が現在の感染者数の推
移.緑が免疫を獲得した人の推移です.(今書いていて,移動確率を人数にせずに,格子全体での確率にしたのはわかりにくいですね.近いうちに改良し
ます.---すみませんまだ修正できていません.2024年2月26日)
I was working on a prototype calculation for the case where the agent moves. Consider the case where a person in this lattice (called an agent in complex systems science) is moved randomly. You can see this calculation at the end of the reference article. I have been working on the algorithm for the last week, and it was quite difficult. At first, I thought of various movement algorithms, calculated them, found a bug, and repeated the calculation with another algorithm. Finally, I was able to create a prototype that I am satisfied with. There may still be some bugs, but I would like to share some of them with the public. Infectious disease experts have often stressed the dangers of people moving and coming into contact with each other, and this can be demonstrated with a simple model. Here are some images and graphs of the calculated 100 days. We have also added a movie.
In the image, white is uninfected, black is a void, and purple is currently infected. Green is the person who has already acquired immunity after infection. The
people on the grid move with a certain probability MP, where MP=0.25
means that 25% of the people are randomly selected per unit of
calculation (in this case, one day) and move in a random direction
(east, west, north, south, south) for one grid position. This is the probability for the entire lattice. Other conditions are the same as in the previous calculation. The yellow graph shows the number of uninfected persons. Purple is the current number of infected persons. The green graph shows the number of immunized persons. (It is difficult to understand why I used the probability of migration for the entire lattice instead of the number of people. I will improve it in the near future.)----Sorry,this has been not fix yet(26th Feb.2024).
感染確率(感染者が1日のうちにほかの人にうつす確率)
Probability of infection (probability that an infected person will infect others in a day) IP=0.25, probability of recovery (probability that an infected person will recover in a day) RP=0.05, void fraction VP=0.5, and probability of migration MP=0.0 (in the absence of migration) after 100 days. White, non-infected; black, void; purple, currently infected; green, recovered and immunized. The initial number of infected individuals starts at 20. The number of lattices is 100x100, which is 10,000. Since the porosity of the lattice is half of the lattice, the number of infected people is not so dense, and the infection has been naturally controlled. The number of people is about 5,000, half the number on the grid. In this calculation, the porosity is as high as half, so the population is not too dense, and the infection is naturally contained. 20 people are initially infected, but the number of clusters is smaller than that because the clusters overlap.
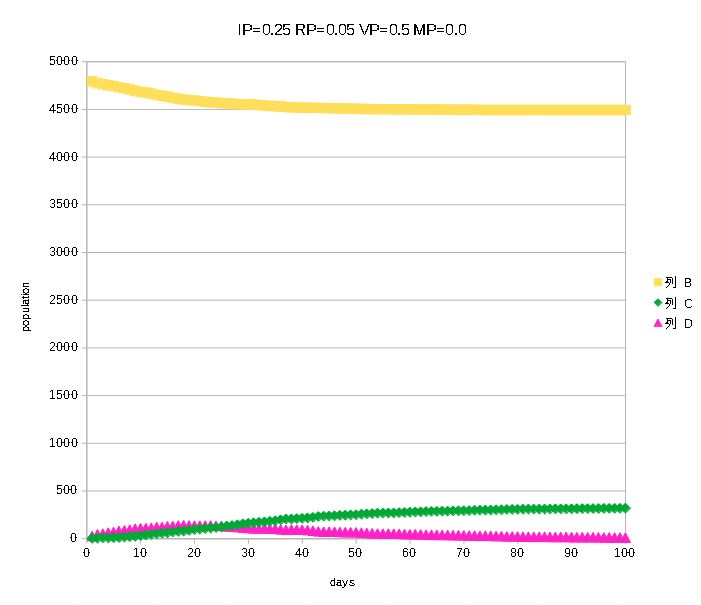
さきほどの条件での,全体の人数から感染者数を引いた非感染者数(黄色),現在の感染者数(紫),快復者数(緑)の時間推移のグラフ.100日分を表示.この計
Graph of the number of non-infected (yellow), the number of infected (purple), and the number of recovered (green) for 100 days. The number of non-infected persons stops around 4,500 according to this calculation. This means that the epidemic is coming to an end in the middle of the time.
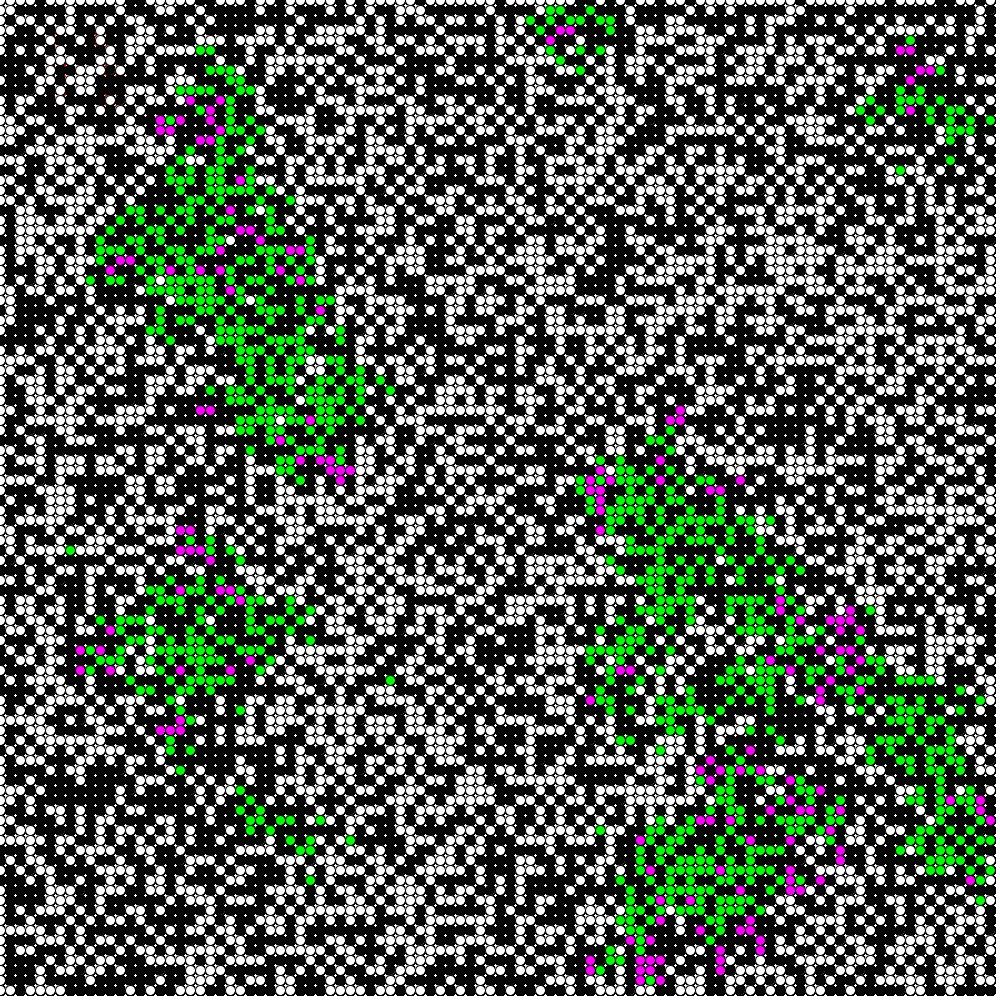
他の条件は同じで,移動の確率を0からMP=0.05,
The other conditions are the same, and the probability of migration is calculated from 0 to MP=0.05, i.e., 5% (about 50 persons) of the entire lattice moves randomly every day (it would be easier to understand this as a percentage of the number of persons, but it is a bit cumbersome, so we use a percentage of the entire lattice). It can be seen that the infection is gradually beginning to progress after only 5% (10% of the total number of people) of the total number of people have moved. The number of currently infected persons (purple, those who have the ability to infect others) is also large.
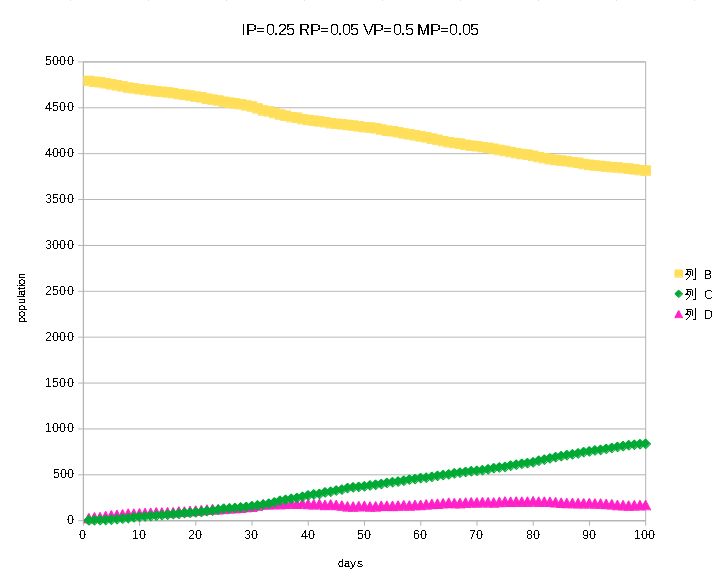
さきほどの全体の格子あたり5%(人口では10%)の移動のグラフ.黄色が以前としてど
The yellow line is decreasing rapidly. In other words, the epidemic is not decreasing, but rather increasing. The number of current infected persons in purple has not decreased much.
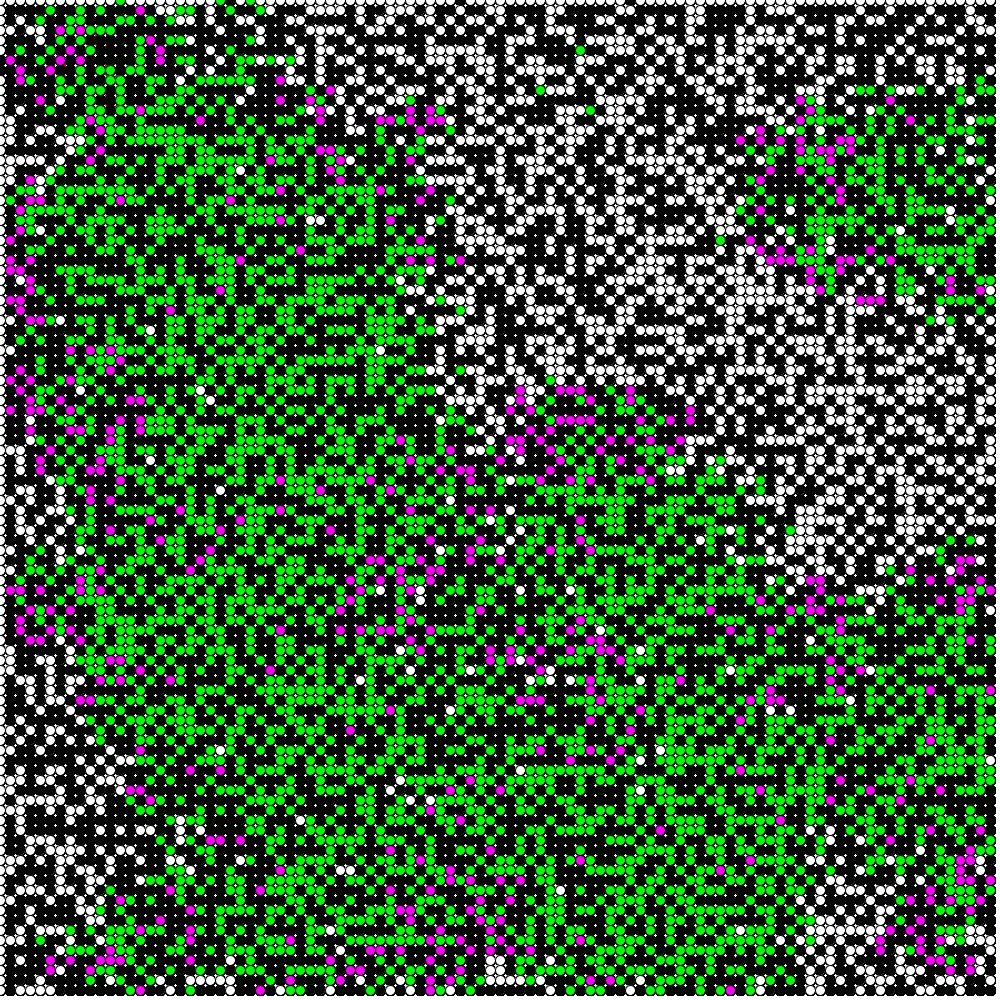
さらに移動確率を格子全体の25%,つまり人数の半分が
Furthermore, when the probability of movement is set to 25% of the entire lattice, i.e., half of the number of people move, we can see that the infection is spreading endlessly.
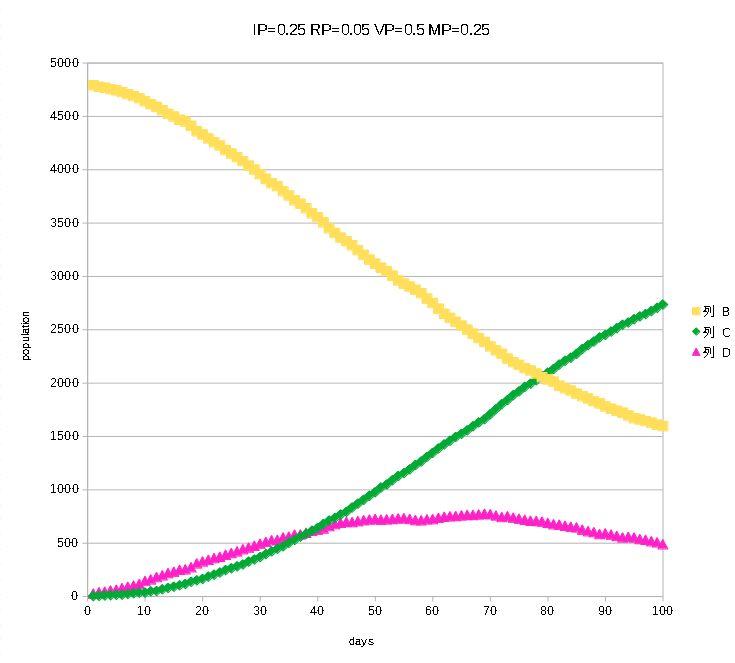
時系列のグラフ.全体の人数の2/
Two thirds of the total number of people have already been infected. The decrease in the yellow graph seems to slow down a little at the end, probably due to the fact that the grid is starting to run out of space. In other words, a larger computational grid would probably eliminate this slowdown. In other words, the effect of "herd immunity" in this closed population is beginning. In fact, the graph of the current number of infections (purple) is beginning to decrease. Although this is a very simple model calculation, it seems to represent well the various characteristics of an infectious disease pandemic.
さきほどの最後の条件で,計算経過の動画を作ってみまし
saveFrame("frames/
と書くだけです.これで連番の画像ファイルが作れること
convert -delay 30 -loop 0 *.png movie.gif
めちゃ便利です!!
と書いてさらに,調べると何とProcessingはム
https://office606.org/
I have made a video of the calculation process under the last condition described above.
The nice thing about Processing is that you can save an image for each frame of an iterative calculation. Just one line
saveFrame("frames/######.png");
is all that is needed. I just realized that I can create sequentially numbered image files with this. I highly recommend this technique for creating animations! By the way, I use ImageMagick's convert command on Linux to create GIF animations from sequentially numbered files. For example
convert -delay 30 -loop 0 *.png movie.gif
It is very convenient!
And then I found out that Processing has a function called Movie Maker, with which you can make movies! I didn't know that!
https://office606.org/archives/1267/