The text was mainly used in the geoscience class of Tennoji high school at OKU at that time as well as in the 3rd grade course "Solid Earth Science II" of the Department of Liberal Arts at Osaka Kyoiku University, which the author has been in charge of since 2012.
1. Seismic wave propagation in our earth interior (Prem Model).
The seismic wave propagation in the earth's interior is usually shown in wave ray paths, however the P-SV wave equation (Vriuex, 1986) was used to calculate the motion of the medium, as in the case of a tsunami. The elastic constants and density of the PREM model (Dziewonsky & Anderson, 1981) were used. The velocity of the medium (not the absolute sum of the two components, but the velocity components in the left and right directions in the figure) is represented by a Povray3 rendering. S-waves are seen to disappear in the outer core, and various refracted and reflected waves are also visible. (First uploaded 07/06/2001, updated 11/28/2012)
August 2020. I found the manuscript of the presentation at the Geoscience Education Society of Japan (1999), now only in Japanese, so I made it available as a pdf file. An example of tsunami calculation is also included.
3. The taver-time curve of the Prem Model simulation
The data of shaking (velocity waveform) recorded by the seismographs
placed at equal intervals on the ground in the above simulation is
recorded as data and displayed as a travel-time curve. It is almost the same as the runtime curve of an actual earthquake (see below). This means that the Prem model's estimation of the subsurface structure is approximately correct.
An example of a runtime curve with a significant phase read from an actual seismic waveform: e.g. https://ds.iris.edu/ds/nodes/dmc/news/2014/09/global-stacks-poster-contest/
In
practice, when there is still a discrepancy between the model and
observations, the model is naturally modified to reveal a more detailed
structure of the Earth's interior. This process can be seen, for example, in Tatsuhiko Hara (2005) https://www.jstage.jst.go.jp/article/jgeography1889/114/3/114_3_323/_pdf/-char/ja (Sorry, in Japanese)
English ver. ref. will be uploaded soon (6th Apr. 2024).
4. (Doraemon model) Simulation movie and drawing of travel time curves
For
comparison, I show the seismic wave propagation and its travel time
curves by my own model of the Earth's interior structure (named
"Doraemon" model, a ridiculous model) instead of the above Prem model
(There is no caption, but it is the same as the Prem model above). ). It
is clear that the "Earth's interior cavity theory" and other demo
theories are completely disproved by seismic wave observations!
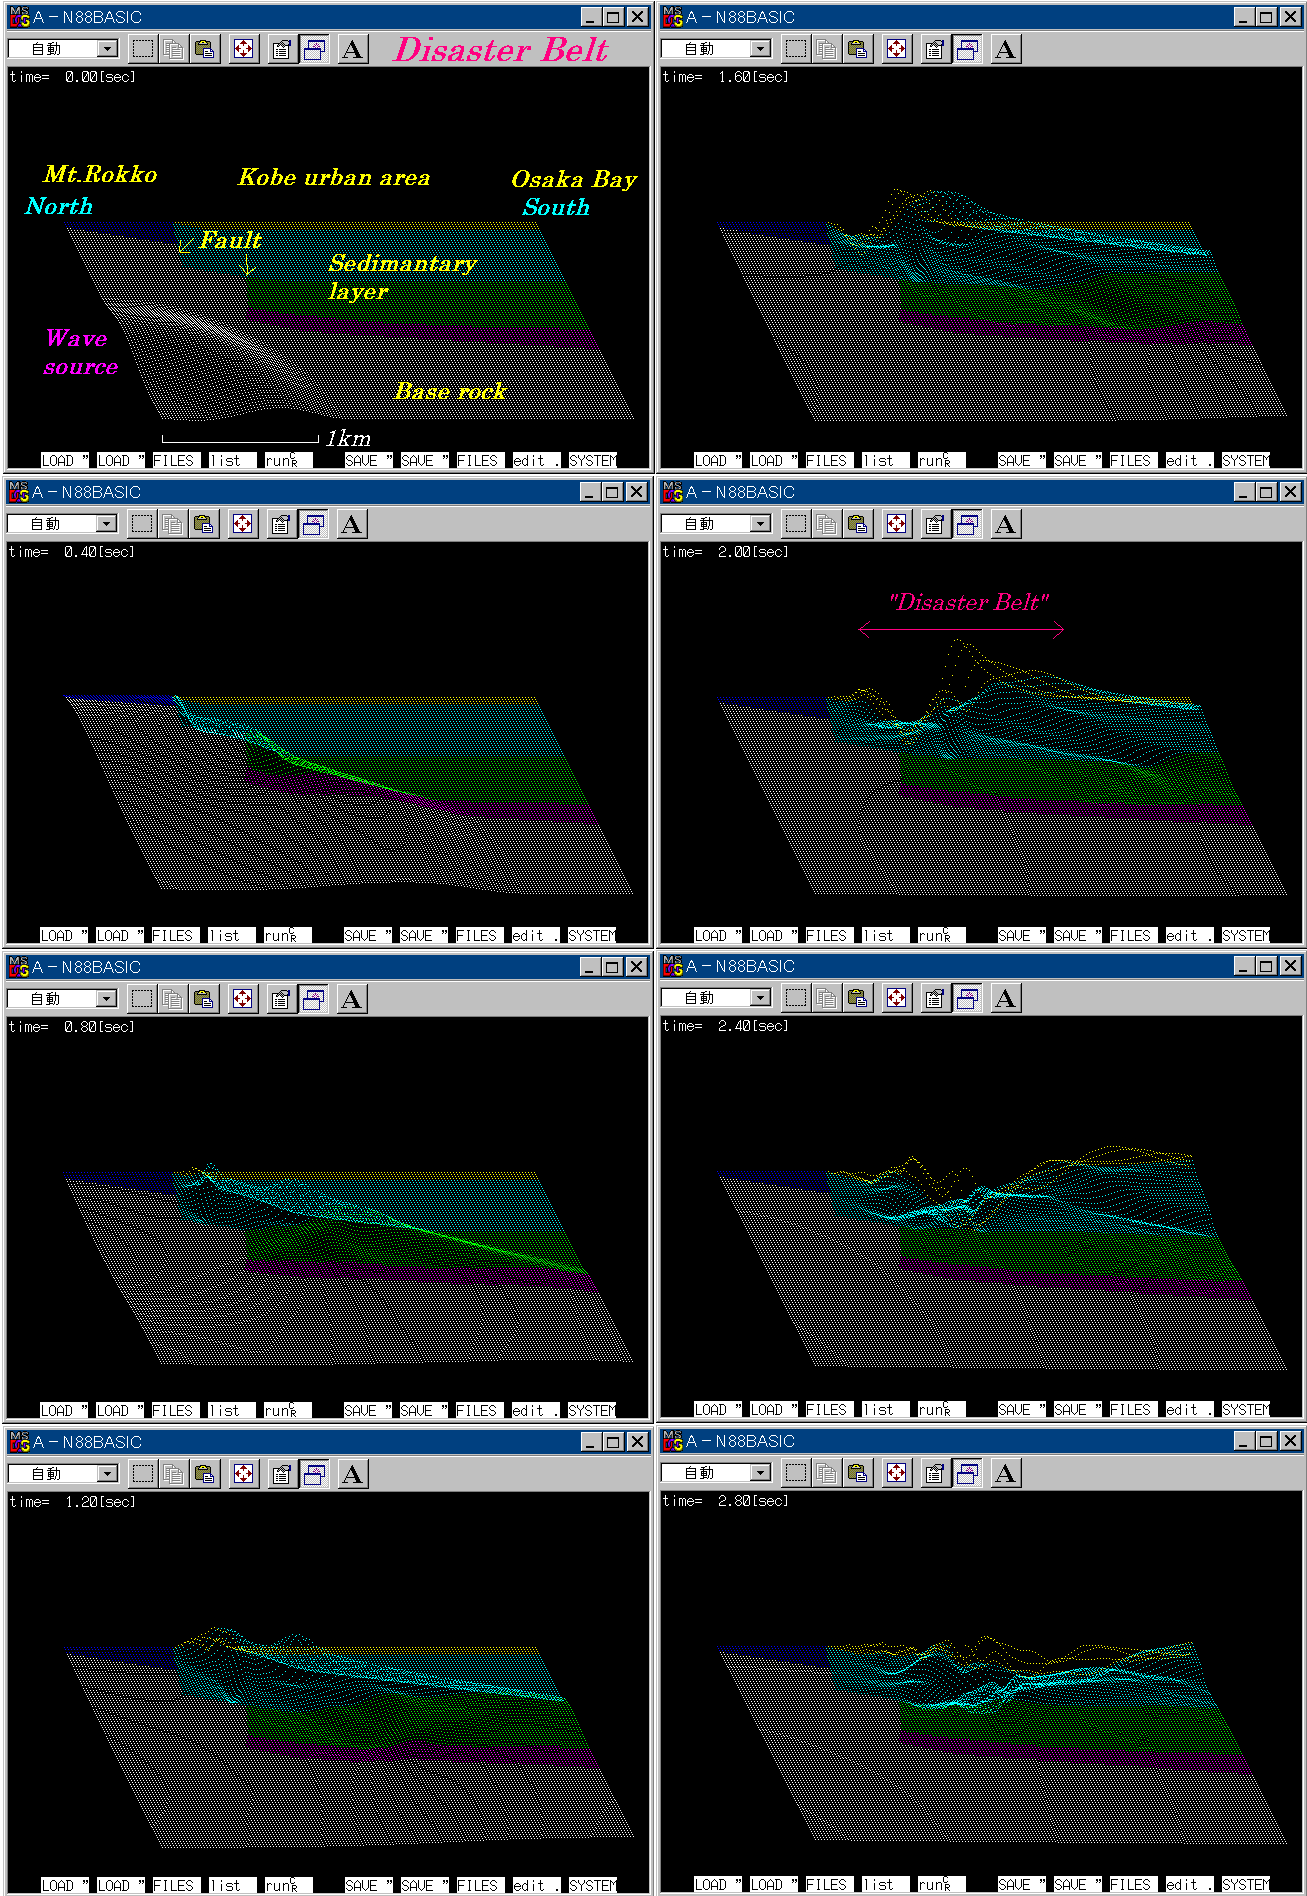
The figure shows the north-south section from Mt. Rokko to Osaka Bay through Kobe urban area. The gray color shows hard granite bedrock. The colored layers are soft sedimentary layers, which become softer from the bottom to the ground. This means that seismic wave velocities slow down. The sedimentary layers act as a convex lens, refracting the seismic waves to focus them on the ground. On the other hand, the exposed granite and hard fan sediments (blue) act as a barrier to the surface waves and reflect them away from the softer sedimentary layers. The combination of these effects produced large amplitude ground motions at the surface level, which is indicated as the "Disaster Belt" in the figure. This is believed to be the cause of the strong shaking disaster belt. However, these facts were first discovered by researchers after the Kobe earthquake and are now lessons for earthquake disaster prevention around the world (see postscript).
<参考文献>
<References>
Yoshio Okamoto (2004): Model-oriented teaching materials for geoscience, especially in the field of earthquakes, Report of the 2004 Joint Meeting of Societies of Earth and Planetary Sciences "An Attempt at New Geoscience Education", 64-75, 2004, (in Japanese) Frontispiece mgp_files